
Compare Pidilite Inds. with Similar Stocks
Dashboard
Strong Long Term Fundamental Strength with an average Return on Equity (ROE) of 20.37%
- Healthy long term growth as Operating profit has grown by an annual rate 16.12%
- The company is Net-Debt Free
Flat results in Mar 26
With ROE of 22.7, it has a Very Expensive valuation with a 14.8 Price to Book Value
High Institutional Holdings at 21.39%
Stock DNA
Specialty Chemicals
INR 160,162 Cr (Large Cap)
65.00
46
0.95%
-0.35
22.70%
14.78
Total Returns (Price + Dividend) 
Latest dividend: 4.993880448440739 per share ex-dividend date: Aug-13-2025
Risk Adjusted Returns v/s
Returns Beta

News
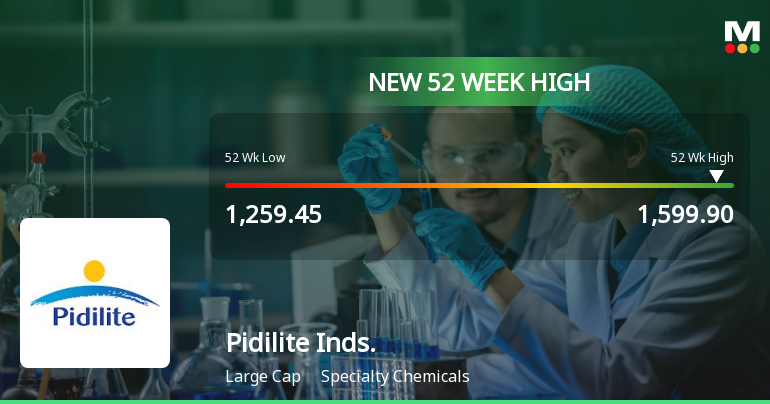
Broad-Based Technical Strength Lifts Pidilite Industries Ltd to 52-Week High of Rs 1599.9
With a fresh 52-week high of Rs 1599.9 reached today, Pidilite Industries Ltd has demonstrated notable price momentum, outperforming its sector and continuing a steady upward trajectory that has seen the stock appreciate 7.77% over the past year against the Sensex’s decline of 5.79%.
Read full news article
Broad-Based Technical Strength Lifts Pidilite Industries Ltd to 52-Week High of Rs 1594.95
With a fresh 52-week high of Rs 1594.95 reached on 22 Jun 2026, Pidilite Industries Ltd has demonstrated notable price momentum, trading comfortably above all key moving averages. This milestone comes amid a broader market rally led by mega caps, with the Sensex gaining 0.43% today and marking a third consecutive week of gains.
Read full news article
Pidilite Industries Ltd is Rated Hold
Pidilite Industries Ltd is rated 'Hold' by MarketsMOJO, a rating that was last updated on 06 May 2026. While this rating change occurred over a month ago, the analysis and financial metrics presented here reflect the company’s current position as of 20 June 2026, providing investors with an up-to-date view of its fundamentals, valuation, financial trends, and technical outlook.
Read full news article Announcements
Communication To Shareholders - Intimation On Tax Deduction On Dividend
18-Jun-2026 | Source : BSECommunication to Shareholders - Intimation on Tax Deduction on Dividend
Announcement under Regulation 30 (LODR)-Analyst / Investor Meet - Intimation
15-Jun-2026 | Source : BSEIntimation of Schedule of Analyst/Institutional Investor Meetings under the SEBI (Listing Obligations and Disclosure Requirements) Regulations 2015
Intimation To Shareholders Holding Shares In Physical Mode Regarding Mandatory Furnishing Of PAN KYC And Bank Details As Per SEBI Master Circular Dated February 06 2026
05-Jun-2026 | Source : BSEIntimation to shareholders holding shares in physical mode regarding mandatory furnishing of PAN KYC and Bank details as per SEBI Master Circular dated February 062026
Corporate Actions

No Upcoming Board Meetings

Pidilite Industries Ltd has declared 1000% dividend, ex-date: 13 Aug 25

No Splits history available

Pidilite Industries Ltd has announced 1:1 bonus issue, ex-date: 23 Sep 25

No Rights history available
Quality key factors
Valuation key factors
Technicals key factors
 Technical Indicator Scale: Bearish, Mildly Bearish, Sideways, Mildly Bullish, Bullish Turned
 Shareholding Snapshot : Mar 2026
Shareholding Compare (%holding)
Promoters
None
Held by 36 Schemes (4.34%)
Held by 754 FIIs (11.75%)
Madhukar Balvantray Parekh Partner Representing Triveni Corporations (9.42%)
Life Insurance Corporation Of India (3.62%)
7.79%
Quarterly Results Snapshot (Consolidated) - Mar'26 - YoY

YoY Growth in quarter ended Mar 2026 is 14.08% vs 8.25% in Mar 2025

YoY Growth in quarter ended Mar 2026 is 37.16% vs 40.50% in Mar 2025
Half Yearly Results Snapshot (Consolidated) - Sep'25
Growth in half year ended Sep 2025 is 10.21% vs 4.39% in Sep 2024
Growth in half year ended Sep 2025 is 13.63% vs 19.95% in Sep 2024
Nine Monthly Results Snapshot (Consolidated) - Dec'25
YoY Growth in nine months ended Dec 2025 is 10.18% vs 5.46% in Dec 2024
YoY Growth in nine months ended Dec 2025 is 13.04% vs 15.76% in Dec 2024
Annual Results Snapshot (Consolidated) - Mar'26
YoY Growth in year ended Mar 2026 is 11.11% vs 6.12% in Mar 2025
YoY Growth in year ended Mar 2026 is 17.95% vs 20.06% in Mar 2025
About Pidilite Industries Ltd

Company Coordinates


