
Compare Pioneer Invest with Similar Stocks
Dashboard
With a Operating Losses, the company has a Weak Long Term Fundamental Strength
- Poor long term growth as Net Sales has grown by an annual rate of 8.96%
- PBT LESS OI(Q) At Rs -5.57 cr has Fallen at -244.5% (vs previous 4Q average)
- PAT(Q) At Rs 1.69 cr has Fallen at -60.4% (vs previous 4Q average)
- CASH AND CASH EQUIVALENTS(HY) Lowest at Rs 4.40 cr
43.48% of Promoter Shares are Pledged
Stock DNA
Non Banking Financial Company (NBFC)
INR 128 Cr (Micro Cap)
8.00
85
0.00%
0.64
9.26%
0.75
Total Returns (Price + Dividend) 
Latest dividend: 0.5 per share ex-dividend date: Aug-30-2012
Risk Adjusted Returns v/s
Returns Beta

News
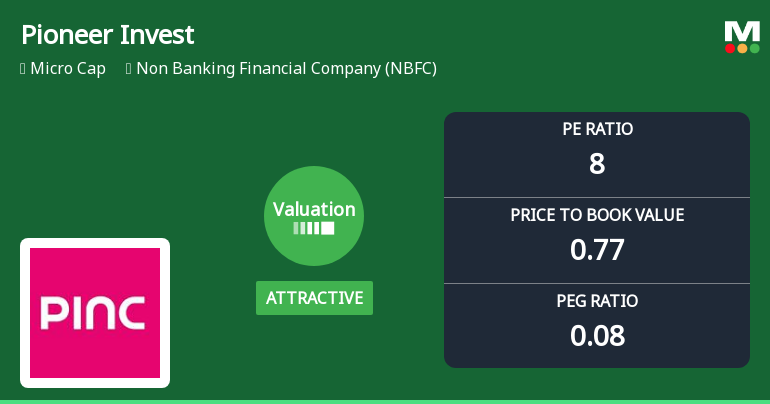
Pioneer Investcorp Ltd Valuation Shifts Signal Renewed Price Attractiveness
Pioneer Investcorp Ltd, a micro-cap player in the Non Banking Financial Company (NBFC) sector, has seen a notable shift in its valuation parameters, moving from very attractive to attractive territory. This change, coupled with its recent market performance and peer comparisons, offers investors a nuanced perspective on its price attractiveness and potential investment merit.
Read full news article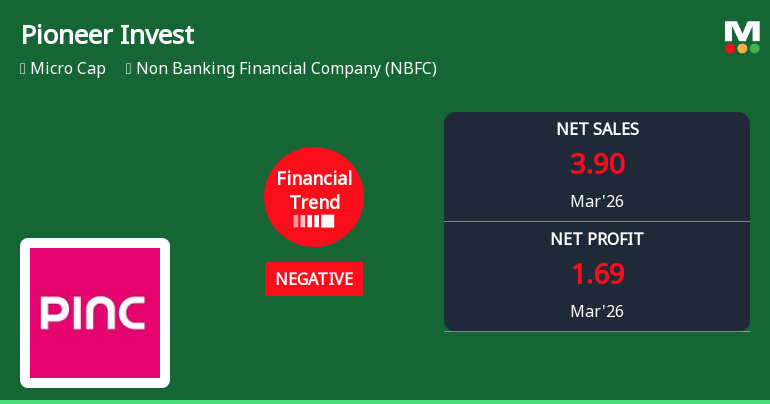
Pioneer Investcorp Ltd Reports Sharp Quarterly Decline Amid Negative Financial Trend
Pioneer Investcorp Ltd, a micro-cap player in the Non Banking Financial Company (NBFC) sector, has reported a significant deterioration in its latest quarterly financial performance, reversing a previously stable trend. The company’s March 2026 quarter results reveal a marked contraction in profitability and operating metrics, prompting a downgrade in its Mojo Grade from Hold to Sell as of 1 April 2026.
Read full news article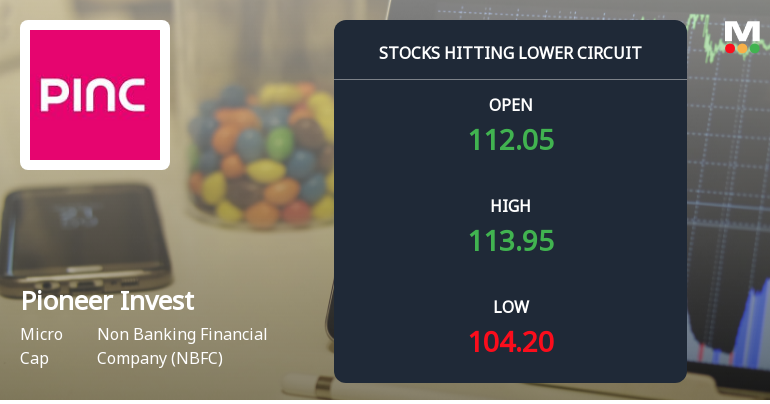
Pioneer Investcorp Ltd Locks at Lower Circuit With 8.61% Loss — Sellers Queue, No Buyers in Sight
At Rs 107.99, sellers were still queuing — but there were no buyers willing to take the other side. Pioneer Investcorp Ltd locked at its lower circuit of 10%% on 2 Jun 2026, with unfilled sell orders and a frozen price, reflecting persistent selling pressure in a micro-cap stock with limited liquidity.
Read full news article Announcements
Announcement under Regulation 30 (LODR)-Newspaper Publication
01-Jun-2026 | Source : BSEIntimation under Regulation 47(3) of SEBI (LODR) Regulations 2015
Board Meeting Outcome for Approval Of Standalone & Consolidated Financial Results And Statement As On 31St March 2026
30-May-2026 | Source : BSEIn compliance with Regulation 30 and 33 of Securities and Exchange Board of India (Listing Obligations and Disclosure Requirements) Regulations 2015 this is to inform that the Board of Directors of the Company at their meeting held on Friday 29th May 2026 has inter alia considered and approved the Standalone & Consolidated Audited Financial Results and Financial statements along with Auditors Report for the Fourth quarter and financial year ended 31st March 2026. Pursuant to Regulation 33(3)(d) of the Securities and Exchange Board of India (Listing Obligations and Disclosure Requirements) Regulations 2015 as amended we do hereby confirm that the Statutory auditors of the Company M/s. Jayesh Dadia & Associates LLP have expressed unmodified opinion(s) in its audit report pertaining to the Standalone & Consolidated Audited financial results for the quarter and year ended 31st March 2026.
Financial Results As On 31St March 2026
30-May-2026 | Source : BSEStandalone and Consolidated Financial Results as on 31st March 2026
Corporate Actions

No Upcoming Board Meetings

Pioneer Investcorp Ltd has declared 5% dividend, ex-date: 30 Aug 12

No Splits history available

No Bonus history available

No Rights history available
Quality key factors
Valuation key factors
Technicals key factors
 Technical Indicator Scale: Bearish, Mildly Bearish, Sideways, Mildly Bullish, Bullish Turned
 Shareholding Snapshot : Mar 2026
Shareholding Compare (%holding)
Promoters
43.4799
Held by 0 Schemes
Held by 1 FIIs (2.99%)
Gaurang Manhar Gandhi (64.6%)
Vss Iron And Minerals Private Ltd (4.68%)
18.05%
Quarterly Results Snapshot (Consolidated) - Mar'26 - QoQ

QoQ Growth in quarter ended Mar 2026 is -67.31% vs -23.38% in Dec 2025
QoQ Growth in quarter ended Mar 2026 is -70.66% vs 18.76% in Dec 2025
Half Yearly Results Snapshot (Consolidated) - Sep'25

Growth in half year ended Sep 2025 is 85.64% vs 6.05% in Sep 2024
Growth in half year ended Sep 2025 is 137.64% vs 727.91% in Sep 2024
Nine Monthly Results Snapshot (Consolidated) - Dec'25
YoY Growth in nine months ended Dec 2025 is 62.81% vs 9.04% in Dec 2024
YoY Growth in nine months ended Dec 2025 is 181.58% vs 591.78% in Dec 2024
Annual Results Snapshot (Consolidated) - Mar'26
YoY Growth in year ended Mar 2026 is 29.06% vs 1.80% in Mar 2025
YoY Growth in year ended Mar 2026 is 101.65% vs 93.86% in Mar 2025
About Pioneer Investcorp Ltd

Company Coordinates


