
Compare Plaza Wires with Similar Stocks
Stock DNA
Cables - Electricals
INR 201 Cr (Micro Cap)
28.00
47
0.00%
0.25
5.64%
1.59
Total Returns (Price + Dividend) 
Plaza Wires for the last several years.
Risk Adjusted Returns v/s
Returns Beta

News
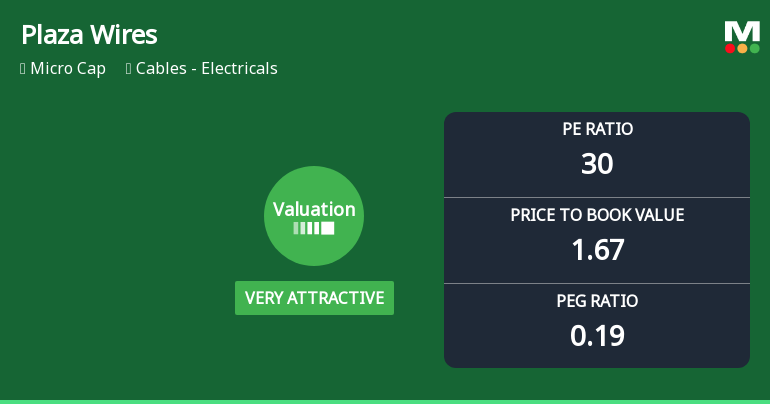
Plaza Wires Ltd Valuation Shifts to Very Attractive Amid Market Volatility
Plaza Wires Ltd has witnessed a notable shift in its valuation parameters, moving from a fair to a very attractive rating, despite a recent downgrade in its overall Mojo Grade to Sell. This change reflects evolving market perceptions and valuation metrics in the cables electricals sector, offering investors a fresh perspective on the stock’s price attractiveness relative to its peers and historical benchmarks.
Read full news article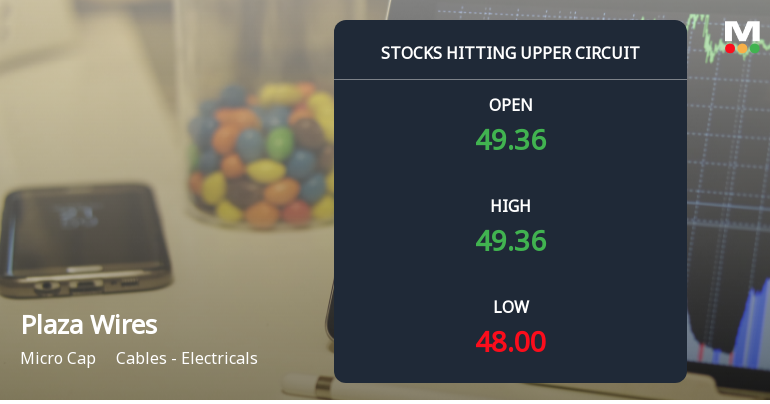
Plaza Wires Ltd Locks at Upper Circuit With 5.0% Gain — Buyers Queue, Sellers Absent
At Rs 49.15, the buying was done — not because demand dried up, but because the exchange wouldn't let the stock go any higher. Plaza Wires Ltd locked at its upper circuit of 5.0% on 1 Jun 2026, with buyers queuing and no sellers willing to part with shares.
Read full news article
Plaza Wires Ltd is Rated Hold by MarketsMOJO
Plaza Wires Ltd is rated 'Hold' by MarketsMOJO, with this rating last updated on 18 May 2026. While the rating change occurred on that date, the analysis and financial metrics presented here reflect the stock's current position as of 31 May 2026, providing investors with the latest insights into the company’s performance and outlook.
Read full news article Announcements
Announcement under Regulation 30 (LODR)-Newspaper Publication
01-Jun-2026 | Source : BSERegulation 47 of SEBI (Listing Obligation and Disclosure Requirements) Regulation 2015- Submission of Newspaper Publication of the Audited Financial for the quarter and year ended 31st March 2026.
Board Meeting Outcome for Outcome Of Board Meeting Pursuant To Regulation 30 And 33(3) And Other Applicable Provisions Of SEBI (Listing Obligations And Disclosure Requirements) Regulations 2015.
29-May-2026 | Source : BSEOutcome of Board Meeting dated 29.05.2026.
Announcement under Regulation 30 (LODR)-Change in Management
29-May-2026 | Source : BSERegulation 30 of Securities and Exchange of India (LODR) Regulations 2015-Change in Management/Appointment of Auditors (General).
Corporate Actions

No Upcoming Board Meetings

No Dividend history available

No Splits history available

No Bonus history available

No Rights history available
Quality key factors
Valuation key factors
Technicals key factors
 Technical Indicator Scale: Bearish, Mildly Bearish, Sideways, Mildly Bullish, Bullish Turned
 Shareholding Snapshot : Mar 2026
Shareholding Compare (%holding)
Promoters
None
Held by 0 Schemes
Held by 1 FIIs (0.03%)
Sanjay Gupta (36.28%)
None
28.45%
Quarterly Results Snapshot (Standalone) - Mar'26 - QoQ

QoQ Growth in quarter ended Mar 2026 is 67.82% vs -11.04% in Dec 2025

QoQ Growth in quarter ended Mar 2026 is 117.22% vs 246.15% in Dec 2025
Half Yearly Results Snapshot (Standalone) - Sep'25
Growth in half year ended Sep 2025 is 47.32% vs -1.15% in Sep 2024
Growth in half year ended Sep 2025 is 90.48% vs -67.06% in Sep 2024
Nine Monthly Results Snapshot (Standalone) - Dec'25
YoY Growth in nine months ended Dec 2025 is 42.72% vs -1.08% in Dec 2024
YoY Growth in nine months ended Dec 2025 is 223.81% vs -65.57% in Dec 2024
Annual Results Snapshot (Standalone) - Mar'26
YoY Growth in year ended Mar 2026 is 45.78% vs 9.74% in Mar 2025
YoY Growth in year ended Mar 2026 is 153.47% vs -21.74% in Mar 2025
About Plaza Wires Ltd

Company Coordinates


