
Compare P.M. Telelinnks with Similar Stocks
Dashboard
Weak Long Term Fundamental Strength with a -4.85% CAGR growth in Operating Profits over the last 5 years
- Company's ability to service its debt is weak with a poor EBIT to Interest (avg) ratio of 0.14
- The company has been able to generate a Return on Equity (avg) of 5.28% signifying low profitability per unit of shareholders funds
Flat results in Dec 25
Risky - Negative EBITDA
Stock DNA
Iron & Steel Products
INR 12 Cr (Micro Cap)
NA (Loss Making)
21
0.00%
0.00
-0.81%
1.42
Total Returns (Price + Dividend) 
P.M. Telelinnks for the last several years.
Risk Adjusted Returns v/s
Returns Beta

News
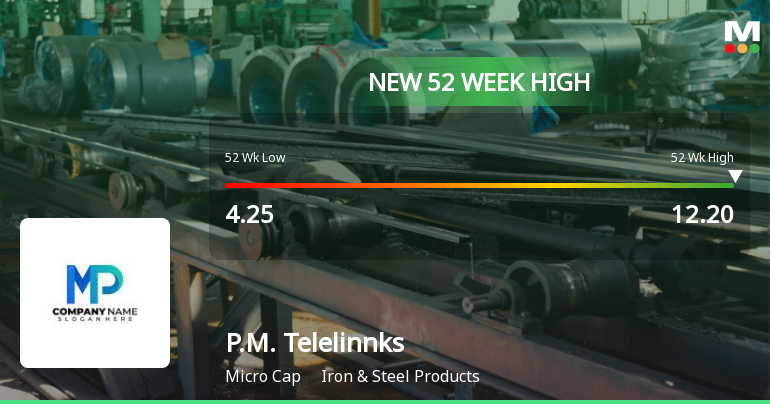
P.M. Telelinnks Ltd Hits New 52-Week High at Rs.12.2
P.M. Telelinnks Ltd, a micro-cap player in the Iron & Steel Products sector, surged to a fresh 52-week high of Rs.12.2 today, marking a significant milestone in its stock performance. This rally reflects a robust momentum that has propelled the stock well above its key moving averages and outpaced sector and broader market indices.
Read full news article Announcements
Closure of Trading Window
27-Mar-2026 | Source : BSEIntimation for closure of Trading Window for the quarter and financial year ended 31st March 2026
Post-Offer Public Announcement
12-Mar-2026 | Source : BSECapitalSquare Advisors Pvt. Ltd. (Manager to the Offer) has submitted to BSE a copy of Post-Offer Public Announcement to the Public Shareholders of P.M. Telelinnks Ltd (Target Company).
Results-Financials For The Quarter Ended 31St December 2025
14-Feb-2026 | Source : BSESubmission of Financial Results for the Quarter Ended 31st December 2025
Corporate Actions

No Upcoming Board Meetings

No Dividend history available

No Splits history available

No Bonus history available

No Rights history available
Quality key factors
Valuation key factors
Technicals key factors
 Technical Indicator Scale: Bearish, Mildly Bearish, Sideways, Mildly Bullish, Bullish Turned
 Shareholding Snapshot : Dec 2025
Shareholding Compare (%holding)
Non Institution
None
Held by 0 Schemes
Held by 0 FIIs
Gulab Chand Pukhraj Surana (10.93%)
Pramod Kumar Jain Securities Private Limited (2.84%)
44.85%
Quarterly Results Snapshot (Standalone) - Dec'25 - QoQ

QoQ Growth in quarter ended Dec 2025 is -68.42% vs -44.12% in Sep 2025

QoQ Growth in quarter ended Dec 2025 is 150.00% vs -700.00% in Sep 2025
Half Yearly Results Snapshot (Standalone) - Sep'24
Growth in half year ended Sep 2024 is -82.07% vs 49.12% in Sep 2023
Growth in half year ended Sep 2024 is -142.86% vs 16.67% in Sep 2023
Nine Monthly Results Snapshot (Standalone) - Dec'24
YoY Growth in nine months ended Dec 2024 is -77.42% vs 26.97% in Dec 2023
YoY Growth in nine months ended Dec 2024 is -77.78% vs -66.67% in Dec 2023
Annual Results Snapshot (Standalone) - Mar'25
YoY Growth in year ended Mar 2025 is -77.51% vs -4.18% in Mar 2024
YoY Growth in year ended Mar 2025 is -87.50% vs -50.00% in Mar 2024
About P.M. Telelinnks Ltd

Company Coordinates


