
Compare PNGS Reva Diamo. with Similar Stocks
Stock DNA
Gems, Jewellery And Watches
INR 1,260 Cr (Small Cap)
20.00
52
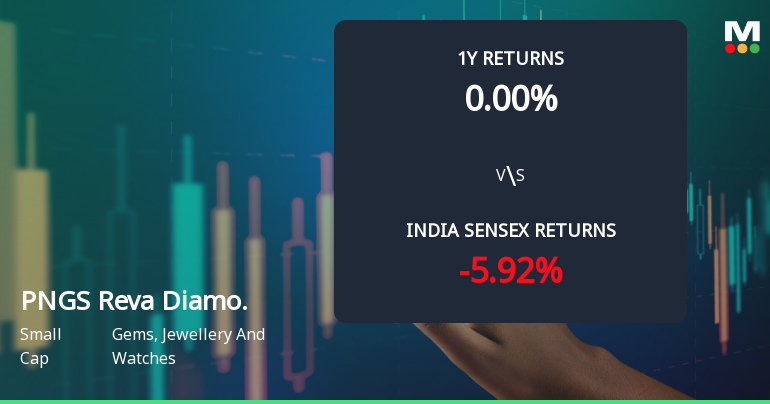
0.00%
-0.30
12.55%
2.46
Total Returns (Price + Dividend) 
PNGS Reva Diamo. for the last several years.
Risk Adjusted Returns v/s
Returns Beta

News
PNGS Reva Diamond Jewellery Limited Technical Momentum Shifts Amid Market Volatility
PNGS Reva Diamond Jewellery Limited, a small-cap player in the Gems, Jewellery and Watches sector, has experienced a notable shift in its technical momentum, moving from a mildly bullish stance to a sideways trend. This change comes amid a complex backdrop of mixed technical indicator signals and recent price volatility, prompting a reassessment of the stock’s near-term outlook.
Read full news article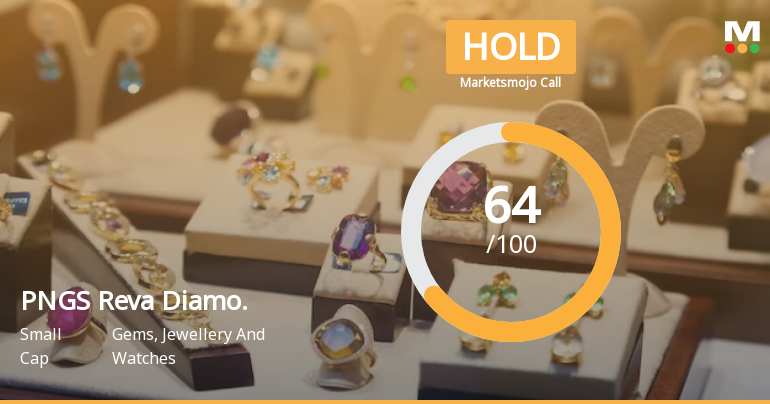
PNGS Reva Diamond Jewellery Limited is Rated Hold
PNGS Reva Diamond Jewellery Limited is rated 'Hold' by MarketsMOJO, with this rating last updated on 15 June 2026. However, the analysis and financial metrics discussed here reflect the stock's current position as of 13 July 2026, providing investors with an up-to-date view of the company’s performance and outlook.
Read full news article
PNGS Reva Diamond Jewellery Limited Shows Technical Momentum Shift Amid Market Recovery
PNGS Reva Diamond Jewellery Limited has shifted from a sideways technical trend to a mildly bullish stance, supported by key momentum indicators and moving averages. The stock’s recent price action, combined with improved technical signals, suggests a cautiously optimistic outlook for investors in the gems and jewellery sector.
Read full news article Announcements
Compliances-Certificate under Reg. 74 (5) of SEBI (DP) Regulations 2018
11-Jul-2026 | Source : BSEWe hereby submit the Certificate received from M/s Bigshare Services Private Limited RTA of the company pursuant to Regulation 74(5) of SEBI (DP) Regulations 2018 for the quarter ended June 30 2026.
Quarterly Update - Q1 - (FY 2026-2027)
08-Jul-2026 | Source : BSEEnclosed herewith Quarterly Business update for the quarter ended June 30 2026. (Q1- FY 2026-2027).
Announcement Under Regulation 30 SEBI (LODR) 2015 - Opening Of An Exclusive Brand Store At Amanora Mall Hadapsar Pune
07-Jul-2026 | Source : BSEThe company has opened its Exclusive Brand Store at Ground Floor West Block- Amanora Mall Amanora Park Township Mundhwa Road Hadapsar Kharadi Bypass Hadapsar Pune-411028 today i.e. on July 07 2026.
Corporate Actions

No Upcoming Board Meetings

No Dividend history available

No Splits history available

No Bonus history available

No Rights history available
Quality key factors
Valuation key factors
Technicals key factors
 Technical Indicator Scale: Bearish, Mildly Bearish, Sideways, Mildly Bullish, Bullish Turned
 Shareholding Snapshot : Mar 2026
Shareholding Compare (%holding)
Promoters
None
Held by 2 Schemes (4.53%)
Held by 7 FIIs (5.27%)
Renu Govind Gadgil (24.45%)
Tata Mutual Fund- Tata Value Fund (4.04%)
12.24%
Quarterly Results Snapshot (Standalone) - Mar'26 - QoQ

QoQ Growth in quarter ended Mar 2026 is -4.20% vs 40.02% in Dec 2025
QoQ Growth in quarter ended Mar 2026 is -7.36% vs 82.26% in Dec 2025
Half Yearly Results Snapshot (Standalone) - Sep'25
Not Applicable: The company has declared_date for only one period
Not Applicable: The company has declared_date for only one period
Nine Monthly Results Snapshot (Standalone) - Dec'25
Not Applicable: The company has declared_date for only one period
Not Applicable: The company has declared_date for only one period
Annual Results Snapshot (Standalone) - Mar'26

YoY Growth in year ended Mar 2026 is 580.98% vs -67.04% in Mar 2025
YoY Growth in year ended Mar 2026 is 881.18% vs -84.46% in Mar 2025
About PNGS Reva Diamond Jewellery Limited

Company Coordinates


