POCL Enterprises

  • Market Cap: Micro Cap
  • Industry: Commodity Chemicals
  • ISIN: INE035S01028
  • NSEID: POEL
  • BSEID: 539195
INR
136.90
-0.55 (-0.4%)
BSENSE

Sep 21, 03:30 PM

BSE+NSE Vol: 6.27 k

  • Price Points
  • Score
  • Mojo Parameters
  • Total Return
  • News and Corporate Actions
  • Key factors
  • Shareholding
  • Financials
  • CompanyCV
stock-summaryPrice Point
High/Low

1Day

52 Week

Valuation
Technical
Day's Volume

CASH

6.27 k (-35.33%) Volume

Shareholding (Jun 2026)

FII

0.24%

Held by 1 FIIs

DII

0.02%

Held by 0 DIIs

Promoter

40.28%

Why is POCL Enterprises Ltd falling/rising?

06-Sep-2026

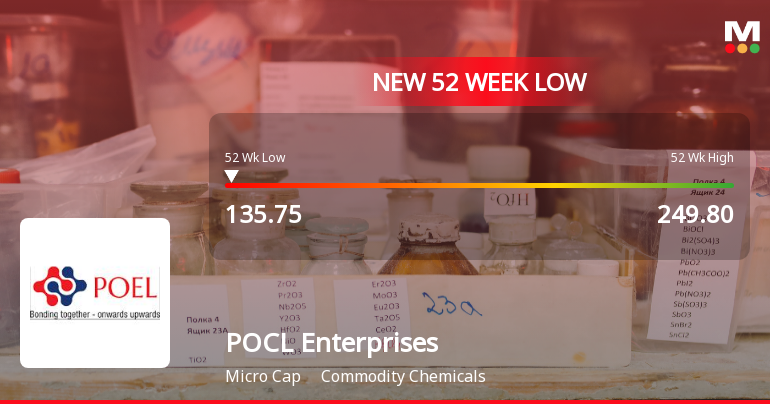
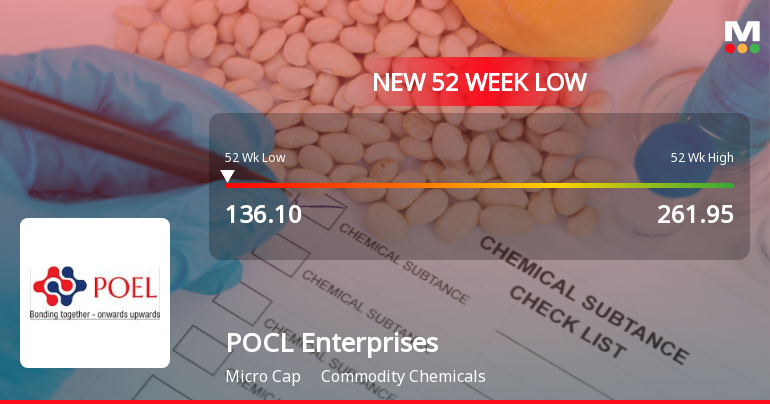
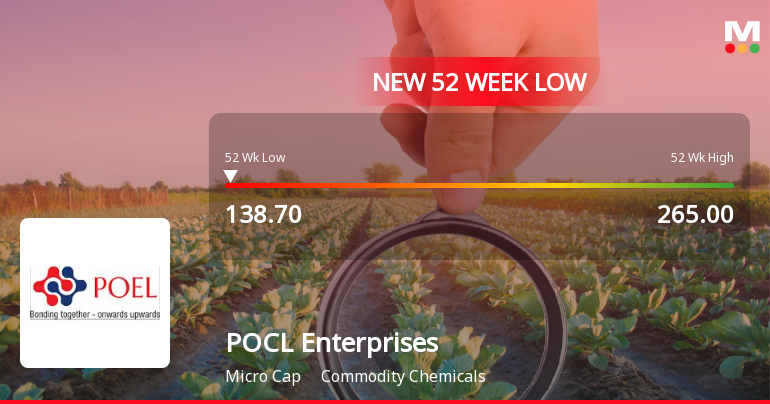
As of 05-Sep, POCL Enterprises Ltd's stock price is declining, currently at Rs. 142.30, with a total drop of -4.73% over the last four days and significant underperformance over the year. Poor financial results and persistent bearish trends contribute to the negative outlook for the stock.

As of 05-Sep, POCL Enterprises Ltd is experiencing a decline in its stock price, currently at Rs. 142.30, which reflects a change of -2.55 (-1.76%). The stock has been on a downward trend, having fallen for the last four consecutive days, resulting in a total decline of -4.73% during this period. Today, the stock hit a new 52-week low of Rs. 141, indicating significant bearish sentiment among investors.<BR><BR>The stock's performance over various periods highlights its struggles, with a year-to-date decline of -30.31% and a one-year drop of -39.07%, significantly underperforming the broader market, which has only seen a -5.21% decline in the same timeframe. Additionally, the stock has underperformed its sector by -2.89% today, further contributing to the negative outlook.<BR><BR>Technical indicators show that POCL Enterprises is trading below its 5-day, 20-day, 50-day, 100-day, and 200-day moving averages, suggesting a persistent bearish trend. Despite a rise in investor participation, with delivery volume increasing by 108.16% against the 5-day average, the overall market sentiment remains weak.<BR><BR>Financial results have also played a crucial role in the stock's decline. The company reported a significant drop in profit before tax and profit after tax in its latest quarterly results, with decreases of -50.2% and -40.8%, respectively, compared to previous quarters. This disappointing performance, coupled with a decline in profits by -9.4% over the past year, has contributed to the stock's negative trajectory.<BR><BR>In summary, the combination of poor financial results, a significant decline in stock price, and underperformance relative to both the market and sector are key factors driving the falling price of POCL Enterprises Ltd.

View full answer

Who are in the management team of POCL Enterprises?

01-Sep-2026

The management team of POCL Enterprises includes key individuals such as Devakar Bansal, Sunil Kumar Bansal, and Padam Chandra Bansal, along with several executive and independent directors, all contributing to the company's governance and strategic direction.

The management team of POCL Enterprises includes the following key individuals:<BR><BR>1. **Devakar Bansal** - Executive Director, Managing Director, and Promoter<BR>2. **Sunil Kumar Bansal** - Executive Director, Managing Director, and Promoter<BR>3. **Padam Chandra Bansal** - Chairman & Non-Executive Director<BR>4. **Y V Raman** - Executive Director and Wholetime Director<BR>5. **Harish Kumar Lohia** - Independent Non-Executive Director<BR>6. **Indra Somani** - Independent Non-Executive Director<BR>7. **Jyoti Kumar Chowdhry** - Independent Non-Executive Director<BR>8. **Harsh Bansal** - Wholetime Director and Executive Director<BR>9. **Amber Bansal** - Executive Director, Wholetime Director, Chief Financial Officer, and Promoter<BR>10. **Shyam Sunder Tikmani** - Independent Director<BR><BR>This team plays a crucial role in the governance and strategic direction of the company.

View full answer

What does POCL Enterprises do?

01-Sep-2026

POCL Enterprises Ltd manufactures and trades metals, chemicals, and their oxides in the commodity chemicals industry. As of June 2026, it reported net sales of 466 Cr and a net profit of 6 Cr, with a market cap of INR 461 Cr.

Overview:<BR>POCL Enterprises Ltd specializes in the manufacturing and trading of various metals, chemicals, and their oxides within the commodity chemicals industry and operates in the micro-cap market.<BR><BR>History:<BR>POCL Enterprises Ltd was incorporated in 1988 as a trading house and has since expanded to include manufacturing processes following a demerger. The latest quarterly results reported net sales and profit for June 2026.<BR><BR>Financial Snapshot:<BR>Net Sales: 466 Cr (Quarterly Results - Jun 2026) <BR>Net Profit: 6 Cr (Quarterly Results - Jun 2026) <BR>Market Cap: INR 461 Cr (Micro Cap)<BR><BR>Key Metrics:<BR>P/E: 13.00 <BR>Industry P/E: 14 <BR>Dividend Yield: 0.74% <BR>Debt-Equity: 0.57 <BR>Return on Equity: 17.58% <BR>Price to Book: 2.39 <BR><BR>Contact Details:<BR>Address: Wellington Crescent 1st Floor, 6/2 Pycrofts Garden Road Chennai Tamil Nadu : 600006 <BR>Email: info@poel.in <BR>Website: http://www.poel.in

View full answer

Who are the peers of the POCL Enterprises?

01-Sep-2026

POCL Enterprises' peers include Tuticorin Alkali, Kanoria Chem., Chemfab Alka., and others, with varying management and growth risks. Kanoria Chem. leads in 1-year returns at 90.55%, while POCL Enterprises has a return of -36.94%.

Peers: The peers of POCL Enterprises are Tuticorin Alkali, Kanoria Chem., Chemfab Alka., Blue Pearl Agri, Primo Chemicals, Mangalam Organic, Lords Chloro, Alufluoride, National Perox., and Andhra Petrochem.<BR><BR>Quality Snapshot: Excellent management risk is observed at Alufluoride, while Average management risk is found at Tuticorin Alkali, Chemfab Alka., Blue Pearl Agri, Primo Chemicals, Mangalam Organic, Lords Chloro, and Andhra Petrochem, and the rest. Below Average management risk is present at Kanoria Chem. and National Perox. In terms of Growth, Excellent growth is noted for POCL Enterprises, while Good growth is seen at Tuticorin Alkali and Lords Chloro, Average growth is found at Blue Pearl Agri, and the rest, and Below Average growth is observed at Kanoria Chem., Chemfab Alka., Primo Chemicals, Mangalam Organic, and National Perox. Capital Structure is Excellent at Chemfab Alka. and National Perox., Good at Blue Pearl Agri, Alufluoride, and Andhra Petrochem, Average at Primo Chemicals, and Below Average at POCL Enterprises, Mangalam Organic, and Kanoria Chem.<BR><BR>Return Snapshot: The peer with the highest 1-year return is Kanoria Chem. at 90.55%, while the peer with the lowest is Blue Pearl Agri at -92.33%. POCL Enterprises has a 1-year return of -36.94%, which is significantly lower than Kanoria Chem. and higher than Blue Pearl Agri. Additionally, the six-month return is negative for Blue Pearl Agri, Chemfab Alka., and Mangalam Organic.

View full answer

How big is POCL Enterprises?

01-Sep-2026

As of 31st August, POCL Enterprises Ltd has a market capitalization of 461.00 Cr, with recent net sales of 1525.30 Cr and a net profit of 36.32 Cr. Shareholder's funds are 97.90 Cr and total assets amount to 224.38 Cr as of March 2025.

As of 31st August, POCL Enterprises Ltd has a market capitalization of 461.00 Cr, categorizing it as a Micro Cap company.<BR><BR>In the latest 4 quarters, the company reported Net Sales of 1525.30 Cr and a Net Profit of 36.32 Cr.<BR><BR>The latest annual period for the balance sheet is March 2025, with Shareholder's Funds amounting to 97.90 Cr and Total Assets of 224.38 Cr.

View full answer

Should I buy, sell or hold POCL Enterprises Ltd?

16-Aug-2026

Are POCL Enterprises Ltd latest results good or bad?

26-May-2026

POCL Enterprises Ltd's latest results show strong profit growth with a net profit of ₹12.80 crores, up 40.81% quarter-on-quarter, but revenue declined by 8.82% from the previous quarter, raising concerns about demand sustainability. While the profit increase is positive, the revenue drop and modest margins suggest challenges ahead.

POCL Enterprises Ltd's latest results present a mixed picture. On one hand, the company reported a consolidated net profit of ₹12.80 crores for Q4 FY26, which is a significant increase of 40.81% quarter-on-quarter and 21.67% year-on-year. This marks the highest quarterly profit in the company's history, indicating improved operational efficiency and cost management.<BR><BR>However, the revenue figures tell a different story. The net sales for the same quarter were ₹332.29 crores, reflecting a decline of 8.82% from the previous quarter and a 10.76% drop year-on-year. This decline in revenue raises concerns about demand sustainability in the competitive commodity chemicals sector, where the company operates.<BR><BR>Additionally, while the operating margin improved slightly to 5.21%, it remains modest, highlighting ongoing margin pressures. The company's return on equity (ROE) of 23.14% is strong, indicating effective capital deployment.<BR><BR>Overall, while the profit growth is a positive sign, the revenue contraction and modest margins suggest that the company is facing challenges. Investors reacted positively to the profit increase, as evidenced by a 4.31% rise in share price following the results announcement, but the underlying revenue issues may warrant caution moving forward.

View full answer

When is the next results date for POCL Enterprises Ltd?

20-May-2026

The next results date for POCL Enterprises Ltd is 25 May 2026.

The next results date for POCL Enterprises Ltd is scheduled for 25 May 2026.

View full answer

Is POCL Enterprises technically bullish or bearish?

28-Nov-2025

As of November 27, 2025, POCL Enterprises has shifted to a bearish trend with moderate strength, supported by bearish indicators from MACD, Bollinger Bands, and moving averages, despite a bullish weekly RSI.

As of 27 November 2025, the technical trend for POCL Enterprises has changed from mildly bearish to bearish. The current stance is bearish with moderate strength. The weekly MACD is bearish, and both the weekly and monthly Bollinger Bands confirm a bearish outlook. Daily moving averages also indicate a bearish trend. Although the weekly RSI shows bullish momentum, it is overshadowed by the overall bearish indicators, including the KST and Dow Theory, which are both bearish on a weekly basis. The stock has underperformed significantly against the Sensex over multiple time frames, further supporting the bearish sentiment.

View full answer

Is POCL Enterprises overvalued or undervalued?

18-Nov-2025

As of November 17, 2025, POCL Enterprises is fairly valued with a PE ratio of 16.20, an EV to EBITDA of 10.09, and strong profitability metrics, despite recent stock performance lagging behind the Sensex.

As of 17 November 2025, the valuation grade for POCL Enterprises has moved from attractive to fair, indicating a shift in its perceived value. The company appears to be fairly valued at this time. Key ratios include a PE ratio of 16.20, an EV to EBITDA of 10.09, and a PEG ratio of 0.71, which suggest that while the company is performing well, it is not significantly undervalued compared to its peers.<BR><BR>In comparison to its industry peers, POCL Enterprises has a PE ratio that is lower than Hindustan Zinc's 19.35, which is considered very expensive, and slightly higher than Vedanta's 15.12, which is viewed as very attractive. Additionally, the company's ROCE of 30.15% and ROE of 38.34% highlight strong profitability metrics. Despite recent stock performance lagging behind the Sensex, particularly in the short term, the long-term returns over 3 years and 5 years have been exceptional, reinforcing the overall valuation perspective.

View full answer

How has been the historical performance of POCL Enterprises?

17-Nov-2025

For the fiscal year ending March 2025, POCL Enterprises reported a net profit of 31.18 crore and net sales of 1,450.10 crore, with an earnings per share of 11.18 and a profit after tax margin of 2.15%. The company maintained a balanced financial position with total assets and liabilities both at 224.38 crore and positive cash flow from operating activities of 40.00 crore.

Answer:<BR>The historical performance of POCL Enterprises shows a consolidated net profit of 31.18 crore for the year ending March 2025, with net sales reaching 1,450.10 crore. The total operating income was also 1,450.10 crore, while total expenditure, excluding depreciation, amounted to 1,387.40 crore. This resulted in an operating profit (PBDIT) of 63.93 crore, leading to a profit before tax of 41.80 crore after accounting for interest expenses of 18.73 crore. The company reported a profit after tax margin of 2.15%, with earnings per share standing at 11.18.<BR><BR>Breakdown:<BR>In the fiscal year ending March 2025, POCL Enterprises achieved net sales of 1,450.10 crore, with total operating income matching this figure. The company incurred total expenditures of 1,387.40 crore, resulting in an operating profit (PBDIT) of 63.93 crore. After accounting for interest expenses of 18.73 crore, the profit before tax was recorded at 41.80 crore, leading to a profit after tax of 31.18 crore. The earnings per share were reported at 11.18, reflecting the company's profitability. Additionally, the total assets of the company reached 224.38 crore, while total liabilities stood at 224.38 crore, indicating a balanced financial position. The cash flow from operating activities was 40.00 crore, showcasing a positive operational cash flow trend.

View full answer

Who are the top shareholders of the POCL Enterprises?

06-Jun-2025

The top shareholders of POCL Enterprises include Neelam Bansal with 10.56% and Sangeetha S with 2.77%. Individual investors hold a significant 51.96%, with no mutual funds or foreign institutional investors involved, and no pledged promoter holdings.

The top shareholders of POCL Enterprises include Neelam Bansal, who holds the highest promoter stake at 10.56%. The highest public shareholder is Sangeetha S, with a holding of 2.77%. Additionally, individual investors collectively hold a significant portion of the company, accounting for 51.96% of the shares. There are no mutual funds or foreign institutional investors currently holding shares in the company, and there are no pledged promoter holdings.

View full answer

Has POCL Enterprises declared dividend?

06-Jun-2025

POCL Enterprises Ltd has declared a 25% dividend, amounting to ₹2.5 per share, with an ex-date of August 30, 2024. The company has shown impressive total returns over various periods, with a total return of 6161.09% over the last five years.

POCL Enterprises Ltd has declared a 25% dividend.<BR><BR>Dividend Details:<BR>- Percentage announced: 25%<BR>- Amount per share: 2.5<BR>- Ex-date: 30 Aug 24<BR><BR>Dividend Yield: 0.21%.<BR><BR>Total Returns by Period:<BR>In the 6-month period, the price return was 7.1%, with no dividend return, resulting in a total return of 7.1%.<BR><BR>For the 1-year period, the price return was 250.2%, the dividend return was 2.88%, leading to a total return of 253.08%.<BR><BR>Over the 2-year period, the price return reached 710.82%, with a dividend return of 11.82%, culminating in a total return of 722.64%.<BR><BR>In the 3-year period, the price return was 1918.01%, while the dividend return was 42.78%, resulting in a total return of 1960.79%.<BR><BR>For the 4-year period, the price return was 2482.88%, with a dividend return of 41.02%, leading to a total return of 2523.9%.<BR><BR>In the 5-year period, the price return was 6043.6%, accompanied by a dividend return of 117.49%, resulting in a total return of 6161.09%.<BR><BR>Overall, POCL Enterprises Ltd has declared a significant dividend and demonstrated impressive total returns across all periods, indicating strong financial performance and shareholder value enhancement.

View full answer
iScoreScore
Click here to find our call on this stock
Strong Sell
Sell
Hold
Buy
Strong Buy

Dashboard

1

Negative results in Jun 26

  • PAT(Q) At Rs 6.17 cr has Fallen at -40.8% (vs previous 4Q average)
  • OPERATING PROFIT TO INTEREST (Q) Lowest at 2.80 times
  • DEBTORS TURNOVER RATIO(HY) Lowest at 15.49 times
2

Underperformed the market in the last 1 year

stock-summaryMojo Parameters

Mojo Parameters

Loading Valuation Snapshot...

Stock DNA

stock-summary
Industry

Commodity Chemicals

stock-summary
Market cap

INR 428 Cr (Micro Cap)

stock-summary
P/E

12.00

stock-summary
Industry P/E

13

stock-summary
Dividend Yield

0.88%

stock-summary
Debt Equity

0.57

stock-summary
Return on Equity

17.58%

stock-summary
Price to Book

2.19

Revenue and Profits:
Net Sales:
466 Cr
(Quarterly Results - Jun 2026)
Net Profit:
6 Cr
stock-summaryTotal Returns
Total Returns (Price + Dividend) stock-summary
Dividend Yield (0.88%)
TimePeriod
Price Return
Dividend Return
Total Return
3 Months
-23.0%
0.46%
-22.54%
6 Months
-18.99%
0.50%
-18.49%
1 Year
-42.3%
0.51%
-41.79%
2 Years
-11.3%
1.24%
-10.06%
3 Years
263.23%
6.25%
269.48%
4 Years
413.12%
9.82%
422.94%
5 Years
1350.21%
28.63%
1378.84%

Latest dividend: 0.8 per share ex-dividend date: Sep-04-2026

Risk Adjusted Returns v/s stock-summary
Returns Beta
Icon
Beta has not been calculated since enough price history is not available
stock-summaryNews & Corporate Actions

Announcements stock-summary

Announcement under Regulation 30 (LODR)-Newspaper Publication

05-Sep-2026 | Source : BSE

Intimation regarding the news paper publication after the dispatch of the AGM Notice of the 38th Annual General Meeting Annual Report for the FY 2025-26 and e-voting information.

Issuance Of Letter To Shareholders Under Regulation 36(1)(B) Of The SEBI (Listing Obligations And Disclosure Requirements) Regulations 2015

04-Sep-2026 | Source : BSE

Intimation about the letter sent to the shareholders under Regulation 36(1)(b) of the SEBI (Listing Obligations and Disclosure Requirements) Regulations 2015

Reg. 34 (1) Annual Report.

04-Sep-2026 | Source : BSE

Annual Report for the FY 2025-26 is enclosed. The cut-off date for remote e-voting / e-voting during the AGM for the resolutions proposed to be passed at the 38th Annual General Meeting is Monday September 21 2026.

Corporate Actions stock-summary

stock-summary
BOARD MEETING

No Upcoming Board Meetings

stock-summary
DIVIDEND

POCL Enterprises Ltd has declared 40% dividend, ex-date: 04 Sep 26

stock-summary
SPLITS

POCL Enterprises Ltd has announced 2:10 stock split, ex-date: 25 Oct 24

stock-summary
BONUS

No Bonus history available

stock-summary
RIGHTS

No Rights history available

stock-summaryKey Factors

Quality key factors stock-summary

Factor
Value
Sales Growth (5y)
32.83%
EBIT Growth (5y)
49.75%
EBIT to Interest (avg)
2.87
Debt to EBITDA (avg)
4.59
Net Debt to Equity (avg)
0.57
Sales to Capital Employed (avg)
5.09
Tax Ratio
26.31%
Dividend Payout Ratio
6.26%
Pledged Shares
0
Institutional Holding
0.26%
ROCE (avg)
17.25%
ROE (avg)
22.77%

Valuation key factors

Factor
Value
P/E Ratio
12
Industry P/E
13
Price to Book Value
2.19
EV to EBIT
9.20
EV to EBITDA
8.40
EV to Capital Employed
1.76
EV to Sales
0.35
PEG Ratio
NA
Dividend Yield
0.87%
ROCE (Latest)
22.04%
ROE (Latest)
17.58%

Technicals key factors

Indicator
Weekly
Monthly
MACD
Bearish
Mildly Bearish
RSI
No Signal
No Signal
Bollinger Bands
Bearish
Bearish
Moving Averages
Bearish (Daily)
KST
Bearish
Mildly Bearish
Dow Theory
No Trend
Mildly Bearish
OBV
Bearish
No Trend
stock-summary Technical Indicator Scale: Bearish, Mildly Bearish, Sideways, Mildly Bullish, Bullish  Turned 
stock-summaryShareholding
Shareholding Snapshot : Jun 2026stock-summary
Shareholding Compare (%holding) stock-summary
Majority shareholders

Non Institution

Pledged Promoter Holdings

None

Mutual Funds

Held by 0 Schemes

FIIs

Held by 1 FIIs (0.24%)

Promoter with highest holding

Neelam Bansal (10.05%)

Highest Public shareholder

Naresh Kumar Ghogar (2.74%)

Individual Investors Holdings

51.84%

stock-summaryFinancial
[
  {
    "link": "quarterly",
    "btn_text": "All Quarterly Results",
    "header": "Quarterly Results Snapshot (Consolidated) - Jun'26 - QoQ",
    "rhs": [
      {
        "prefix": "Net Sales ",
        "suffix": "QoQ Growth in quarter ended Jun 2026 is 40.25% vs -8.82% in Mar 2026",
        "dir": 1
      },
      {
        "prefix": "Consolidated Net Profit ",
        "suffix": "QoQ Growth in quarter ended Jun 2026 is -51.80% vs 40.81% in Mar 2026",
        "dir": -1
      }
    ],
    "table": {
      "header": [
        "Jun'26",
        "Mar'26",
        "Change(%)"
      ],
      "body": [
        {
          "field": "Net Sales",
          "val1": "466.04",
          "val2": "332.29",
          "chgp": "40.25%",
          "chgp_class": "positive"
        },
        {
          "field": "Operating Profit (PBDIT) excl Other Income",
          "val1": "11.70",
          "val2": "17.32",
          "chgp": "-32.45%",
          "chgp_class": "negative"
        },
        {
          "field": "Interest",
          "val1": "4.18",
          "val2": "3.80",
          "chgp": "10.00%",
          "chgp_class": "negative"
        },
        {
          "field": "Exceptional Items",
          "val1": "0.00",
          "val2": "0.00",
          "chgp": "",
          "chgp_class": "neutral"
        },
        {
          "field": "Consolidate Net Profit",
          "val1": "6.17",
          "val2": "12.80",
          "chgp": "-51.80%",
          "chgp_class": "negative"
        },
        {
          "field": "Operating Profit Margin (Excl OI)",
          "val1": "2.51%",
          "val2": "5.21%",
          "chgp": "-2.70%",
          "chgp_class": "negative"
        }
      ]
    }
  },
  {
    "link": "half-yearly",
    "btn_text": "All Half Yearly Results",
    "header": "Half Yearly Results Snapshot (Standalone) - Sep'25",
    "rhs": [
      {
        "prefix": "Net Sales ",
        "suffix": " Growth in half year ended Sep 2025 is -0.22% vs 32.33% in Sep 2024",
        "dir": -1
      },
      {
        "prefix": "Standalone Net Profit ",
        "suffix": " Growth in half year ended Sep 2025 is 34.59% vs 146.51% in Sep 2024",
        "dir": -1
      }
    ],
    "table": {
      "header": [
        "Sep'25",
        "Sep'24",
        "Change(%)"
      ],
      "body": [
        {
          "field": "Net Sales",
          "val1": "734.98",
          "val2": "736.62",
          "chgp": "-0.22%",
          "chgp_class": "negative"
        },
        {
          "field": "Operating Profit (PBDIT) excl Other Income",
          "val1": "38.71",
          "val2": "31.33",
          "chgp": "23.56%",
          "chgp_class": "positive"
        },
        {
          "field": "Interest",
          "val1": "8.25",
          "val2": "9.23",
          "chgp": "-10.62%",
          "chgp_class": "positive"
        },
        {
          "field": "Exceptional Items",
          "val1": "0.00",
          "val2": "0.00",
          "chgp": "",
          "chgp_class": "neutral"
        },
        {
          "field": "Standalone Net Profit",
          "val1": "21.40",
          "val2": "15.90",
          "chgp": "34.59%",
          "chgp_class": "positive"
        },
        {
          "field": "Operating Profit Margin (Excl OI)",
          "val1": "5.27%",
          "val2": "4.25%",
          "chgp": "1.02%",
          "chgp_class": "positive"
        }
      ]
    }
  },
  {
    "link": "nine-monthly",
    "btn_text": "All Nine Monthly Results",
    "header": "Nine Monthly Results Snapshot (Standalone) - Dec'25",
    "rhs": [
      {
        "prefix": "Net Sales ",
        "suffix": "YoY Growth in nine months ended Dec 2025 is 2.01% vs 32.60% in Dec 2024",
        "dir": -1
      },
      {
        "prefix": "Standalone Net Profit ",
        "suffix": "YoY Growth in nine months ended Dec 2025 is 39.05% vs 94.13% in Dec 2024",
        "dir": -1
      }
    ],
    "table": {
      "header": [
        "Dec'25",
        "Dec'24",
        "Change(%)"
      ],
      "body": [
        {
          "field": "Net Sales",
          "val1": "1,099.40",
          "val2": "1,077.74",
          "chgp": "2.01%",
          "chgp_class": "positive"
        },
        {
          "field": "Operating Profit (PBDIT) excl Other Income",
          "val1": "54.93",
          "val2": "44.25",
          "chgp": "24.14%",
          "chgp_class": "positive"
        },
        {
          "field": "Interest",
          "val1": "12.83",
          "val2": "14.24",
          "chgp": "-9.90%",
          "chgp_class": "positive"
        },
        {
          "field": "Exceptional Items",
          "val1": "-0.26",
          "val2": "0.00",
          "chgp": "",
          "chgp_class": "neutral"
        },
        {
          "field": "Standalone Net Profit",
          "val1": "29.91",
          "val2": "21.51",
          "chgp": "39.05%",
          "chgp_class": "positive"
        },
        {
          "field": "Operating Profit Margin (Excl OI)",
          "val1": "5.00%",
          "val2": "4.11%",
          "chgp": "0.89%",
          "chgp_class": "positive"
        }
      ]
    }
  },
  {
    "link": "annual",
    "btn_text": "All Annual Results",
    "header": "Annual Results Snapshot (Standalone) - Mar'26",
    "rhs": [
      {
        "prefix": "Net Sales ",
        "suffix": "YoY Growth in year ended Mar 2026 is -1.27% vs 29.42% in Mar 2025",
        "dir": -1
      },
      {
        "prefix": "Standalone Net Profit ",
        "suffix": "YoY Growth in year ended Mar 2026 is 27.04% vs 75.76% in Mar 2025",
        "dir": -1
      }
    ],
    "table": {
      "header": [
        "Mar'26",
        "Mar'25",
        "Change(%)"
      ],
      "body": [
        {
          "field": "Net Sales",
          "val1": "1,431.68",
          "val2": "1,450.10",
          "chgp": "-1.27%",
          "chgp_class": "negative"
        },
        {
          "field": "Operating Profit (PBDIT) excl Other Income",
          "val1": "72.25",
          "val2": "62.70",
          "chgp": "15.23%",
          "chgp_class": "positive"
        },
        {
          "field": "Interest",
          "val1": "16.63",
          "val2": "18.73",
          "chgp": "-11.21%",
          "chgp_class": "positive"
        },
        {
          "field": "Exceptional Items",
          "val1": "-0.26",
          "val2": "0.00",
          "chgp": "",
          "chgp_class": "neutral"
        },
        {
          "field": "Standalone Net Profit",
          "val1": "39.61",
          "val2": "31.18",
          "chgp": "27.04%",
          "chgp_class": "positive"
        },
        {
          "field": "Operating Profit Margin (Excl OI)",
          "val1": "5.05%",
          "val2": "4.32%",
          "chgp": "0.73%",
          "chgp_class": "positive"
        }
      ]
    }
  }
]

Quarterly Results Snapshot (Consolidated) - Jun'26 - QoQstock-summary

Jun'26
Mar'26
Change(%)
Net Sales
466.04
332.29
40.25%
Operating Profit (PBDIT) excl Other Income
11.70
17.32
-32.45%
Interest
4.18
3.80
10.00%
Exceptional Items
0.00
0.00
Consolidate Net Profit
6.17
12.80
-51.80%
Operating Profit Margin (Excl OI)
2.51%
5.21%
-2.70%
Values in Rs Cr.
Direction Arrows
Net Sales

QoQ Growth in quarter ended Jun 2026 is 40.25% vs -8.82% in Mar 2026

Direction Arrows
Consolidated Net Profit

QoQ Growth in quarter ended Jun 2026 is -51.80% vs 40.81% in Mar 2026

Half Yearly Results Snapshot (Standalone) - Sep'25stock-summary

Sep'25
Sep'24
Change(%)
Net Sales
734.98
736.62
-0.22%
Operating Profit (PBDIT) excl Other Income
38.71
31.33
23.56%
Interest
8.25
9.23
-10.62%
Exceptional Items
0.00
0.00
Standalone Net Profit
21.40
15.90
34.59%
Operating Profit Margin (Excl OI)
5.27%
4.25%
1.02%
Values in Rs Cr.
Direction Arrows
Net Sales

Growth in half year ended Sep 2025 is -0.22% vs 32.33% in Sep 2024

Direction Arrows
Standalone Net Profit

Growth in half year ended Sep 2025 is 34.59% vs 146.51% in Sep 2024

Nine Monthly Results Snapshot (Standalone) - Dec'25stock-summary

Dec'25
Dec'24
Change(%)
Net Sales
1,099.40
1,077.74
2.01%
Operating Profit (PBDIT) excl Other Income
54.93
44.25
24.14%
Interest
12.83
14.24
-9.90%
Exceptional Items
-0.26
0.00
Standalone Net Profit
29.91
21.51
39.05%
Operating Profit Margin (Excl OI)
5.00%
4.11%
0.89%
Values in Rs Cr.
Direction Arrows
Net Sales

YoY Growth in nine months ended Dec 2025 is 2.01% vs 32.60% in Dec 2024

Direction Arrows
Standalone Net Profit

YoY Growth in nine months ended Dec 2025 is 39.05% vs 94.13% in Dec 2024

Annual Results Snapshot (Standalone) - Mar'26stock-summary

Mar'26
Mar'25
Change(%)
Net Sales
1,431.68
1,450.10
-1.27%
Operating Profit (PBDIT) excl Other Income
72.25
62.70
15.23%
Interest
16.63
18.73
-11.21%
Exceptional Items
-0.26
0.00
Standalone Net Profit
39.61
31.18
27.04%
Operating Profit Margin (Excl OI)
5.05%
4.32%
0.73%
Values in Rs Cr.
Direction Arrows
Net Sales

YoY Growth in year ended Mar 2026 is -1.27% vs 29.42% in Mar 2025

Direction Arrows
Standalone Net Profit

YoY Growth in year ended Mar 2026 is 27.04% vs 75.76% in Mar 2025

stock-summaryCompany CV
About POCL Enterprises Ltd stock-summary
stock-summary
POCL Enterprises Ltd
Micro Cap
Commodity Chemicals
POCL Enterprises Limited (POEL) initially established in 1988 as a trading house, has over the years after the demerger had manufacturing processes included. POCL Enterprises Limited (POEL) is an ISO 9001:2015 company and specializes in manufacturing and trading of various metals, chemicals and their oxides prior to Demerger. The Company has manufacturing units in Puducherry, Kakkalur - Thiruvallur, Maraimalai Nagar, Tamil Nadu.
Company Coordinates stock-summary
Company Details
Wellington Crescent 1st Floor, 6/2 Pycrofts Garden Road Chennai Tamil Nadu : 600006
stock-summary
Tel:
stock-summary
info@poel.in
Registrar Details
Cameo Corporate Services Ltd , Subramanian Buildings No 1 , Club House Road, Chennai