
Compare Ponni Sug.Erode with Similar Stocks
Dashboard
The company is Net-Debt Free
Poor long term growth as Net Sales has grown by an annual rate of 10.12% and Operating profit at 1.64% over the last 5 years
The company has declared Positive results for the last 3 consecutive quarters
With ROE of 4.1, it has a Fair valuation with a 0.5 Price to Book Value
Majority shareholders : Promoters
Consistent Underperformance against the benchmark over the last 3 years
Total Returns (Price + Dividend) 
Latest dividend: 5.039317507418398 per share ex-dividend date: Jun-05-2026
Risk Adjusted Returns v/s
Returns Beta

News
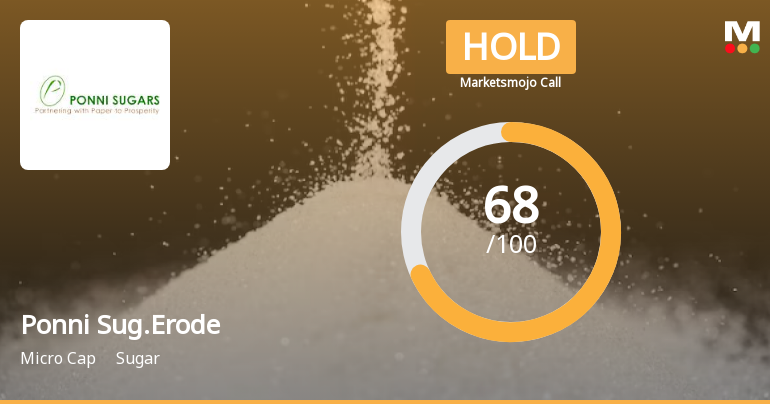
Ponni Sugars (Erode) Ltd is Rated Hold by MarketsMOJO
Ponni Sugars (Erode) Ltd is rated 'Hold' by MarketsMOJO, with this rating last updated on 25 May 2026. However, the analysis and financial metrics discussed here reflect the company’s current position as of 22 June 2026, providing investors with an up-to-date perspective on the stock’s fundamentals, valuation, financial trends, and technical outlook.
Read full news article
Ponni Sugars (Erode) Ltd is Rated Hold by MarketsMOJO
Ponni Sugars (Erode) Ltd is rated 'Hold' by MarketsMOJO, with this rating last updated on 25 May 2026. However, the analysis and financial metrics discussed here reflect the stock's current position as of 11 June 2026, providing investors with an up-to-date view of the company’s fundamentals, returns, and market performance.
Read full news article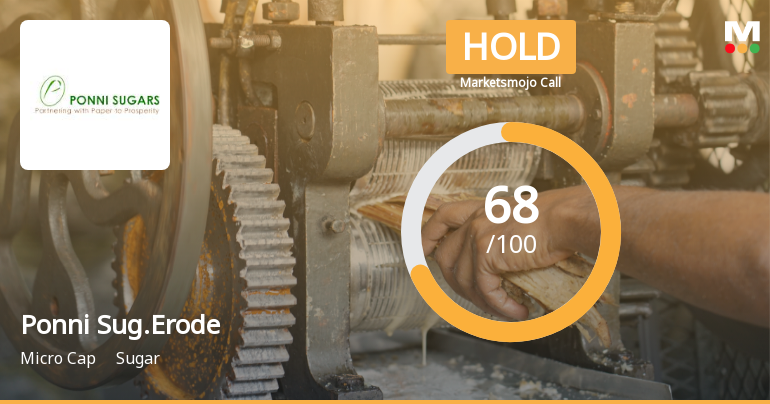
Ponni Sugars (Erode) Ltd Downgraded to Hold Amid Valuation Concerns and Mixed Financial Trends
Ponni Sugars (Erode) Ltd has seen its investment rating downgraded from Buy to Hold as of 25 May 2026, primarily due to a shift in valuation metrics from attractive to fair. While the company continues to demonstrate robust financial trends and maintains a net-debt free status, concerns over its premium valuation relative to peers and subdued long-term growth prospects have tempered enthusiasm among analysts.
Read full news article Announcements
Ponni Sugars (Erode) Limited - Other General Purpose
21-Nov-2019 | Source : NSEPonni Sugars (Erode) Limited has submitted to the Exchange a copy of Related Party Transactions on consolidated basis for the half year ended September 30, 2019.
Ponni Sugars (Erode) Limited - Updates
16-Oct-2019 | Source : NSEPonni Sugars (Erode) Limited has informed the Exchange regarding 'Compliance Certificate for the Quarter ended 30th September 2019 under Regulation 74 (5) of SEBI LODR'.
Updates
25-Jul-2019 | Source : NSE
| Ponni Sugars (Erode) Limited has informed the Exchange regarding 'Newspaper publication of Q1, FY 2019-20 results of the Company'. |
Corporate Actions

No Upcoming Board Meetings

Ponni Sugars (Erode) Ltd has declared 50% dividend, ex-date: 05 Jun 26

No Splits history available

No Bonus history available

No Rights history available
Quality key factors
Valuation key factors
Technicals key factors
 Technical Indicator Scale: Bearish, Mildly Bearish, Sideways, Mildly Bullish, Bullish Turned
 Shareholding Snapshot : Mar 2026
Shareholding Compare (%holding)
Promoters
None
Held by 4 Schemes (0.05%)
Held by 2 FIIs (9.6%)
Seshasayee Paper And Boards Limited (32.35%)
Atyant Capital India Fund I (9.46%)
32.32%
Quarterly Results Snapshot (Standalone) - Mar'26 - QoQ

QoQ Growth in quarter ended Mar 2026 is -40.84% vs 33.08% in Dec 2025

QoQ Growth in quarter ended Mar 2026 is 181.73% vs -34.96% in Dec 2025
Half Yearly Results Snapshot (Standalone) - Sep'25
Growth in half year ended Sep 2025 is 16.63% vs -33.83% in Sep 2024
Growth in half year ended Sep 2025 is -3.73% vs -43.00% in Sep 2024
Nine Monthly Results Snapshot (Standalone) - Dec'25
YoY Growth in nine months ended Dec 2025 is 22.81% vs -24.28% in Dec 2024
YoY Growth in nine months ended Dec 2025 is 44.75% vs -55.71% in Dec 2024
Annual Results Snapshot (Standalone) - Mar'26
YoY Growth in year ended Mar 2026 is 15.45% vs -14.68% in Mar 2025
YoY Growth in year ended Mar 2026 is 149.12% vs -58.86% in Mar 2025
About Ponni Sugars (Erode) Ltd

Company Coordinates


