
Compare Poojawes. Metal. with Similar Stocks
Dashboard
With a Operating Losses, the company has a Weak Long Term Fundamental Strength
- Company's ability to service its debt is weak with a poor EBIT to Interest (avg) ratio of 1.73
- The company has been able to generate a Return on Equity (avg) of 9.99% signifying low profitability per unit of shareholders funds
Flat results in Mar 26
Below par performance in long term as well as near term
Stock DNA
Other Industrial Products
INR 19 Cr (Micro Cap)
13.00
13
0.00%
0.43
9.43%
1.26
Total Returns (Price + Dividend) 
Latest dividend: 1 per share ex-dividend date: Sep-13-2024
Risk Adjusted Returns v/s
Returns Beta

News
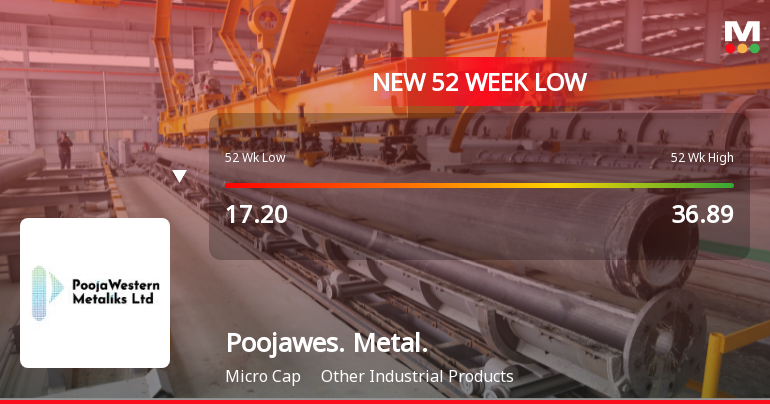
Poojawestern Metaliks Ltd Falls to 52-Week Low of Rs 17 as Sell-Off Deepens
For the fourth consecutive session, Poojawestern Metaliks Ltd has seen its share price decline, culminating in a fresh 52-week low of Rs 17 on 11 Jun 2026. This marks a 14.07% drop over the past four days, underscoring persistent selling pressure despite a broadly recovering market backdrop.
Read full news article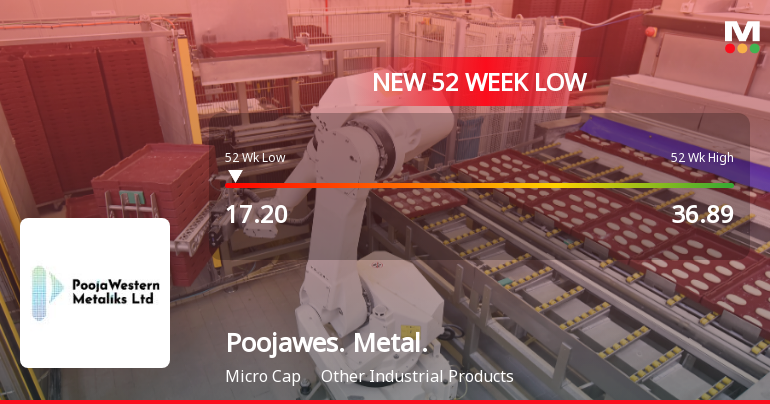
Poojawestern Metaliks Ltd Falls to 52-Week Low of Rs 17.2 as Sell-Off Deepens
For the third consecutive session, Poojawestern Metaliks Ltd has seen its share price decline sharply, culminating in a fresh 52-week low of Rs 17.2 on 10 Jun 2026. This marks a significant 12.67% drop over the past three days, underscoring persistent selling pressure despite a broadly positive market backdrop.
Read full news article
Announcements
Shareholder Meeting / Postal Ballot-Notice of Postal Ballot
17-Jul-2026 | Source : BSEPoojawestern Metaliks Limited has informed the exchange regarding Notice of Postal Ballot.
Board Meeting Outcome for Outcome Of Board Meeting Held Today I.E. On July 16 2026 Pursuant To Regulation 30(6) Of SEBI (Listing Obligations And Disclosure Requirements) Regulations 2015
16-Jul-2026 | Source : BSEWe hereby inform you that the Board of Directors at its meeting held today approved the following: 1. Subject to shareholders and other necessary regulatory approvals the proposal to raise funds through a Rights Issue of partly paid-up Equity Shares of face value ?10 each for an aggregate amount not exceeding ?1500 Lakhs. 2. Subject to shareholders approval the request from Promoter/Promoter Group members Mr. Sunil D. Panchmatiya Mr. Anil D. Panchmatiya Mr. Vivek Panchmatiya and Mr. Meet Panchmatiya to convert their outstanding non-interest-bearing unsecured loans into equity shares against the exercise of their rights entitlement in the proposed Rights Issue. 3. The Postal Ballot Notice explanatory statement and Calendar of Events to seek members approval for the above matters and related actions.
Compliances-Certificate under Reg. 74 (5) of SEBI (DP) Regulations 2018
14-Jul-2026 | Source : BSECertificate under Regulation 74(5) of SEBI (Depositories and participants) Regulations 2018 for the quater ended June 30 2026.
Corporate Actions

No Upcoming Board Meetings

Poojawestern Metaliks Ltd has declared 10% dividend, ex-date: 13 Sep 24

No Splits history available

Poojawestern Metaliks Ltd has announced 1:1 bonus issue, ex-date: 02 Jan 20

No Rights history available
Quality key factors
Valuation key factors
Technicals key factors
 Technical Indicator Scale: Bearish, Mildly Bearish, Sideways, Mildly Bullish, Bullish Turned
 Shareholding Snapshot : Mar 2026
Shareholding Compare (%holding)
Promoters
None
Held by 0 Schemes
Held by 0 FIIs
Sunil Devram Panchmatiya (18.33%)
Pratyush Mittal (1.48%)
34.2%
Quarterly Results Snapshot (Consolidated) - Mar'26 - YoY

YoY Growth in quarter ended Mar 2026 is 52.84% vs -7.68% in Mar 2025

YoY Growth in quarter ended Mar 2026 is -141.82% vs 34.15% in Mar 2025
Half Yearly Results Snapshot (Consolidated) - Sep'25
Growth in half year ended Sep 2025 is 33.48% vs -31.36% in Sep 2024
Growth in half year ended Sep 2025 is 101.56% vs -25.58% in Sep 2024
Nine Monthly Results Snapshot (Consolidated) - Dec'25
YoY Growth in nine months ended Dec 2025 is 46.05% vs -21.40% in Dec 2024
YoY Growth in nine months ended Dec 2025 is 66.00% vs -24.81% in Dec 2024
Annual Results Snapshot (Consolidated) - Mar'26
YoY Growth in year ended Mar 2026 is 48.04% vs -17.82% in Mar 2025
YoY Growth in year ended Mar 2026 is 3.23% vs -11.43% in Mar 2025
About Poojawestern Metaliks Ltd

Company Coordinates


