
Compare Poona Dal & Oil with Similar Stocks
Dashboard
Weak Long Term Fundamental Strength with a -30.20% CAGR growth in Operating Profits over the last 5 years
- Company's ability to service its debt is weak with a poor EBIT to Interest (avg) ratio of 0.90
- The company has been able to generate a Return on Equity (avg) of 2.25% signifying low profitability per unit of shareholders funds
Flat results in Mar 26
Below par performance in long term as well as near term
Total Returns (Price + Dividend) 
Latest dividend: 0.9000 per share ex-dividend date: Sep-19-2013
Risk Adjusted Returns v/s
Returns Beta

News

Poona Dal and Oil Industries Ltd is Rated Strong Sell
Poona Dal and Oil Industries Ltd is rated Strong Sell by MarketsMOJO, with this rating last updated on 09 Dec 2025. However, the analysis and financial metrics discussed here reflect the stock’s current position as of 18 June 2026, providing investors with an up-to-date perspective on the company’s fundamentals, valuation, financial trend, and technical outlook.
Read full news article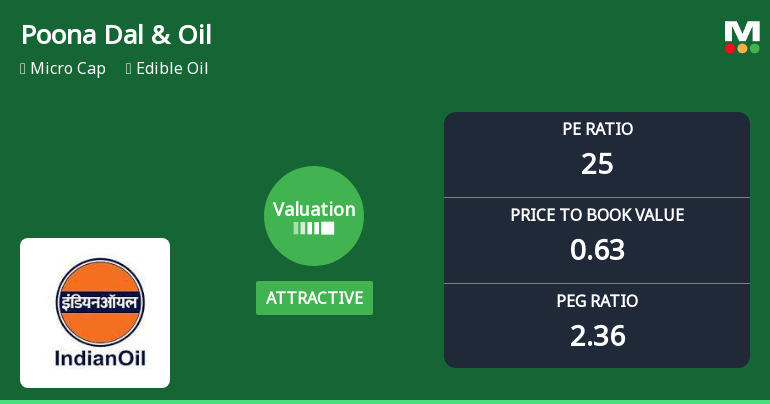
Poona Dal and Oil Industries Ltd: Valuation Shifts Signal Renewed Price Attractiveness
Poona Dal and Oil Industries Ltd has seen a notable shift in its valuation parameters, moving from fair to attractive territory despite a challenging market backdrop. With a current price of ₹63.93 and a micro-cap status, the edible oil company’s price-to-earnings (P/E) and price-to-book value (P/BV) ratios now present a compelling case for value-focused investors, even as its overall market sentiment remains cautious.
Read full news article
Poona Dal and Oil Industries Ltd is Rated Strong Sell
Poona Dal and Oil Industries Ltd is rated Strong Sell by MarketsMOJO. This rating was last updated on 09 Dec 2025. However, the analysis and financial metrics presented here reflect the company’s current position as of 27 May 2026, providing investors with the latest insights into its performance and outlook.
Read full news article Announcements
Compliances-Reg.24(A)-Annual Secretarial Compliance
26-May-2026 | Source : BSEAnnual secretarial Compliance Report under Reg 24(A) for the year ended 31.03.2026
Announcement under Regulation 30 (LODR)-Change in Directorate
20-May-2026 | Source : BSEAccepatnce of Resignation of Existing Non Executive Independent Directors Mr Kewalchand Muthiyan Mr Ajinkya Ghogardrae and Mrs Ligy George and Appointment of New Additional Non executive Independent Directors Ms Ankita Agrawal Mr Rupesh Lohade and Mr N V Kadekar in place of them. Also appointment of Mr Satyen Gathani as an additional executive director of the company w.e..f 19th May 2026 subject to approval of members in ensuing Annual General Meeting.
Results For The Year Ended 31.03.2026
19-May-2026 | Source : BSEAudited Results for the year ended 31.03.2026
Corporate Actions

No Upcoming Board Meetings

Poona Dal and Oil Industries Ltd has declared 9% dividend, ex-date: 19 Sep 13

No Splits history available

No Bonus history available

No Rights history available
Quality key factors
Valuation key factors
Technicals key factors
 Technical Indicator Scale: Bearish, Mildly Bearish, Sideways, Mildly Bullish, Bullish Turned
 Shareholding Snapshot : Mar 2026
Shareholding Compare (%holding)
Promoters
None
Held by 0 Schemes
Held by 0 FIIs
Sudarshanbai Deepchand Parakh (30.75%)
Sangeetha S (1.3%)
26.31%
Quarterly Results Snapshot (Standalone) - Mar'26 - QoQ

QoQ Growth in quarter ended Mar 2026 is -2.96% vs 3.29% in Dec 2025
QoQ Growth in quarter ended Mar 2026 is 23.91% vs 76.92% in Dec 2025
Half Yearly Results Snapshot (Standalone) - Sep'25
Growth in half year ended Sep 2025 is -16.10% vs 59.11% in Sep 2024
Growth in half year ended Sep 2025 is 0.00% vs 24.32% in Sep 2024
Nine Monthly Results Snapshot (Standalone) - Dec'25
YoY Growth in nine months ended Dec 2025 is -7.39% vs 51.36% in Dec 2024
YoY Growth in nine months ended Dec 2025 is 13.58% vs 50.00% in Dec 2024
Annual Results Snapshot (Standalone) - Mar'26
YoY Growth in year ended Mar 2026 is -4.40% vs 49.59% in Mar 2025
YoY Growth in year ended Mar 2026 is 10.45% vs 71.79% in Mar 2025
About Poona Dal and Oil Industries Ltd

Company Coordinates


