Poona Dal & Oil

  • Market Cap: Micro Cap
  • Industry: Edible Oil
  • ISIN: INE809E01018
  • NSEID:
  • BSEID: 519359
INR
66.48
0.38 (0.57%)
BSENSE

May 26

BSE+NSE Vol: 271

  • Price Points
  • Score
  • Mojo Parameters
  • Total Return
  • News and Corporate Actions
  • Key factors
  • Shareholding
  • Financials
  • CompanyCV
stock-summaryPrice Point
High/Low

1Day

52 Week

Valuation
Technical
Day's Volume

CASH

271 (199.12%) Volume

Shareholding (Mar 2026)

FII

0.00%

Held by 0 FIIs

DII

0.00%

Held by 0 DIIs

Promoter

70.38%

Who are in the management team of Poona Dal & Oil?

06-Jun-2025

As of March 2022, the management team of Poona Dal & Oil includes Pradip P Parakh (Chairman & Managing Director), Rakesh Singh (Whole-time Director), and independent directors Kevalchand Manikchand Muthiyan, Ajinkya Ghogardare, and Lizy George. They are responsible for the company's governance and strategic direction.

As of March 2022, the management team of Poona Dal & Oil includes the following individuals:<BR><BR>1. Pradip P Parakh - Chairman & Managing Director<BR>2. Rakesh Singh - Whole-time Director<BR>3. Kevalchand Manikchand Muthiyan - Independent Director<BR>4. Ajinkya Ghogardare - Independent Director<BR>5. Lizy George - Independent Director<BR><BR>These members play key roles in the governance and strategic direction of the company.

View full answer

Has Poona Dal & Oil declared dividend?

06-Jun-2025

Poona Dal & Oil Industries Ltd has declared a 9% dividend, amounting to 0.9000 per share, with an ex-date of September 19, 2013. Despite the dividend declaration, the dividend yield is 0%, and total returns over various periods show significant long-term gains, particularly a 105.59% return over five years.

Poona Dal & Oil Industries Ltd has declared a 9% dividend.<BR><BR>Dividend Details:<BR>- Percentage announced: 9%<BR>- Amount per share: 0.9000<BR>- Ex-date: Sep-19-2013<BR><BR>Dividend Yield: 0%<BR><BR>Total Returns by Period:<BR>In the 6-month period, the price return was -3.54%, the dividend return was 0%, resulting in a total return of -3.54%.<BR><BR>For the 1-year period, the price return was 7.67%, the dividend return was 0%, leading to a total return of 7.67%.<BR><BR>Over the 2-year period, the price return was 35.13%, with a dividend return of 0%, culminating in a total return of 35.13%.<BR><BR>In the 3-year period, the price return was 14.09%, the dividend return was 0%, which resulted in a total return of 14.09%.<BR><BR>For the 4-year period, the price return was 50.42%, with a dividend return of 0%, giving a total return of 50.42%.<BR><BR>In the 5-year period, the price return was 105.59%, the dividend return was 0%, resulting in a total return of 105.59%.<BR><BR>Overall, Poona Dal & Oil Industries Ltd has declared a dividend, but the dividend yield remains at 0%. The total returns over various periods show a mix of positive and negative performance, with significant gains over the longer term, particularly in the 5-year period.

View full answer

Who are the peers of the Poona Dal & Oil?

03-Jun-2025

Poona Dal & Oil's peers include Marico, Patanjali Foods, AWL Agri Business, and others. Its 1-year return is 3.65%, with below-average growth and management risk compared to peers.

Peers: The peers of Poona Dal & Oil are Marico, Patanjali Foods, AWL Agri Busine., Gokul Agro, Sundrop Brands, Paos Industries, Madhusudan Inds., Prima Industries, Integ. Proteins, and Natraj Proteins.<BR><BR>Quality Snapshot: Excellent management risk is observed at Marico, while Average management risk is found at Patanjali Foods, Gokul Agro, and Madhusudan Inds. Below Average management risk is present in AWL Agri Busine., Sundrop Brands, Poona Dal & Oil, Prima Industries, Integ. Proteins, and the rest. Growth is Excellent at Patanjali Foods and Gokul Agro, Good at AWL Agri Busine., while Below Average growth is noted for Marico, Poona Dal & Oil, Madhusudan Inds., Prima Industries, and the rest. Capital Structure is Excellent at Marico and Sundrop Brands, Good at Patanjali Foods and AWL Agri Busine., while Below Average capital structure is seen in Madhusudan Inds. and Integ. Proteins, with the rest having Good capital structure.<BR><BR>Return Snapshot: The peer with the highest 1-year return is Paos Industries at 191.57%, while the lowest is AWL Agri Busine. at -27.23%. Poona Dal & Oil's 1-year return is 3.65%, which is higher than AWL Agri Busine. but lower than most peers. Additionally, AWL Agri Busine., Madhusudan Inds., and Integ. Proteins have negative six-month returns.

View full answer

What is the technical trend for Poona Dal & Oil?

09-Jun-2025

As of June 2, 2025, Poona Dal & Oil shows a neutral technical stance with mixed signals, as the weekly MACD is mildly bullish while the monthly MACD is mildly bearish, and despite bullish Bollinger Bands, daily moving averages are mildly bearish.

As of 2 June 2025, the technical trend for Poona Dal & Oil has changed from mildly bearish to sideways. The weekly MACD is mildly bullish, while the monthly MACD is mildly bearish, indicating mixed signals. The Bollinger Bands are bullish on both weekly and monthly time frames, suggesting potential upward movement. However, the daily moving averages are mildly bearish, which adds caution. The KST and Dow Theory both show a mildly bullish stance on the weekly but are bearish on the monthly. Overall, the current technical stance is neutral, with a balance of bullish and bearish indicators, reflecting indecision in the market.

View full answer

What does Poona Dal & Oil do?

17-Jul-2025

Poona Dal and Oil Industries Ltd is an agro-based company that manufactures and trades edible oil and pulses. As of March 2025, it reported net sales of ₹330 Cr and a net profit of ₹5 Cr, with a market cap of ₹39 Cr.

Overview:<BR>Poona Dal and Oil Industries Ltd is an agro-based company engaged in manufacturing and trading in edible oil and pulses, operating within the micro-cap category of the edible oil industry.<BR><BR>History:<BR>The company was incorporated in 1993 and changed its name from Suryaoday Agro Industries Ltd to Poona Dal and Oil Industries Ltd in 1997. The latest quarterly results reported net sales and profit for the period ending March 2025.<BR><BR>Financial Snapshot:<BR>- Net Sales: 330 Cr (Quarterly Results - Mar 2025)<BR>- Net Profit: 5 Cr (Quarterly Results - Mar 2025)<BR>- Market Cap: INR 39 Cr (Micro Cap)<BR><BR>Key Metrics:<BR>- P/E: 29.00<BR>- Industry P/E: 35<BR>- Dividend Yield: 0.00%<BR>- Debt-Equity: -0.63<BR>- Return on Equity: 2.41%<BR>- Price to Book: 0.70<BR><BR>Contact Details:<BR>Address: 71/A Industrial estate, Hadapsar Pune Maharashtra : 411013<BR>Tel: 91-020-26816020/24<BR>Email: pdoil@pdbmgroup.com<BR>Website: http://www.pdbmgroup.com

View full answer

Who are the top shareholders of the Poona Dal & Oil?

17-Jul-2025

The top shareholders of Poona Dal & Oil include Sudarshanbai Deepchand Parakh, who holds 30.75%, and individual investors with a collective 26.2%, led by Sangeetha S at 1.3%. There are no mutual funds or foreign institutional investors currently holding shares.

The top shareholders of Poona Dal & Oil include the promoters, who hold the majority of the shares. The promoter with the highest holding is Sudarshanbai Deepchand Parakh, owning 30.75% of the company. Additionally, individual investors collectively hold 26.2% of the shares, with the highest public shareholder being Sangeetha S, who holds 1.3%. There are currently no mutual funds or foreign institutional investors (FIIs) holding shares in the company.

View full answer

How big is Poona Dal & Oil?

24-Jul-2025

As of 24th July, Poona Dal and Oil Industries Ltd has a market capitalization of 39.00 Cr, with recent Net Sales of 147.19 Cr and a Net Profit of 1.35 Cr. The company's Shareholder's Funds are 55.63 Cr and Total Assets amount to 56.43 Cr.

As of 24th July, Poona Dal and Oil Industries Ltd has a market capitalization of 39.00 Cr, categorizing it as a Micro Cap company.<BR><BR>In the latest four quarters, the company reported Net Sales of 147.19 Cr and a Net Profit of 1.35 Cr.<BR><BR>The latest annual period for the balance sheet is March 2024, with Shareholder's Funds amounting to 55.63 Cr and Total Assets of 56.43 Cr.

View full answer

Is Poona Dal & Oil overvalued or undervalued?

28-Nov-2025

As of November 27, 2025, Poona Dal & Oil is considered very expensive with a PE ratio of 30.21, significantly higher than its peers, and has underperformed the Sensex with a year-to-date return of -0.21%.

As of 27 November 2025, the valuation grade for Poona Dal & Oil has moved from expensive to very expensive. This indicates that the company is currently overvalued. Key ratios include a PE ratio of 30.21, an EV to EBIT of 1.45, and a ROCE of 3.19%. <BR><BR>In comparison to its peers, Poona Dal & Oil's PE ratio is significantly higher than that of Lloyds Enterprises, which stands at 26.16, and far exceeds the attractive valuation of PTC India at 7.33. The company's recent stock performance has lagged behind the Sensex, with a year-to-date return of -0.21% compared to the Sensex's 9.70%, reinforcing the notion that Poona Dal & Oil is overvalued in the current market context.

View full answer

How has been the historical performance of Poona Dal & Oil?

04-Dec-2025

Poona Dal & Oil has experienced significant fluctuations in financial performance, with net sales declining from 242.53 Cr in Mar'22 to 147.20 Cr in Mar'25, while cash flow from operating activities improved to 24.00 Cr in Mar'25 from a negative 25.00 Cr in Mar'24. Despite declining sales and profits, the company showed positive shifts in cash management.

Answer:<BR>The historical performance of Poona Dal & Oil shows significant fluctuations in key financial metrics over the years.<BR><BR>Breakdown:<BR>Poona Dal & Oil's net sales have varied considerably, peaking at 242.53 Cr in Mar'22 before declining to 147.20 Cr in Mar'25. Total operating income followed a similar trend, reaching a high of 242.53 Cr in Mar'22 and dropping to 147.20 Cr in Mar'25. The raw material cost also saw a decrease from 145.45 Cr in Mar'22 to 108.63 Cr in Mar'25, while the purchase of finished goods dropped significantly from 92.56 Cr in Mar'22 to 8.94 Cr in Mar'25. Operating profit (PBDIT) exhibited a decline from 2.39 Cr in Mar'22 to 2.03 Cr in Mar'25, with the operating profit margin decreasing from 0.63% in Mar'22 to 0.52% in Mar'25. Profit before tax showed a slight increase to 1.84 Cr in Mar'25 from 1.56 Cr in Mar'23, while profit after tax rose to 1.34 Cr in Mar'25 from 1.16 Cr in Mar'23. The company's total assets increased from 55.70 Cr in Mar'23 to 58.01 Cr in Mar'25, with total liabilities also rising from 55.70 Cr to 58.01 Cr in the same period. Cash flow from operating activities improved significantly to 24.00 Cr in Mar'25 from a negative 25.00 Cr in Mar'24, reflecting a positive shift in cash management. Overall, the financial performance of Poona Dal & Oil has shown volatility, with notable improvements in cash flow despite declining sales and profits in recent years.

View full answer

When is the next results date for Poona Dal and Oil Industries Ltd?

13-May-2026

The next results date for Poona Dal and Oil Industries Ltd is 19 May 2026.

The next results date for Poona Dal and Oil Industries Ltd is scheduled for 19 May 2026.

View full answer

Are Poona Dal and Oil Industries Ltd latest results good or bad?

20-May-2026

The latest results for Poona Dal and Oil Industries Ltd show a 23.91% increase in net profit to ₹0.57 crores and a 5.99% year-on-year revenue growth, but the low operating margin of 0.49% and reliance on non-operational income raise concerns about sustainability, indicating mixed overall performance.

The latest results for Poona Dal and Oil Industries Ltd present a mixed picture. In Q4 FY26, the company reported a net profit of ₹0.57 crores, which is a 23.91% increase quarter-over-quarter (QoQ). This indicates some positive momentum in profitability. Additionally, revenue for the same quarter was ₹35.03 crores, reflecting a year-on-year growth of 5.99%, although it saw a decline of 2.96% compared to the previous quarter.<BR><BR>However, the operating margin remains a significant concern, sitting at just 0.49%. This is one of the lowest in the industry and highlights ongoing operational inefficiencies. The company’s profitability is heavily reliant on other income, which accounted for a substantial portion of its reported earnings, raising questions about the sustainability of its core business model.<BR><BR>Overall, while there are some positive signs in terms of net profit growth, the underlying operational challenges, particularly the low operating margins and dependence on non-operational income, suggest that the results are not entirely favorable. The company faces significant hurdles in improving its operational performance in a highly competitive market.

View full answer

Should I buy, sell or hold Poona Dal and Oil Industries Ltd?

21-May-2026

Why is Poona Dal and Oil Industries Ltd falling/rising?

26-May-2026

As of 25-May, Poona Dal and Oil Industries Ltd is experiencing a stock price decline to 66.10, reflecting a -0.45% change. This decline is due to underperformance against its sector, a significant drop in delivery volume, and a recent trend reversal, indicating a potential bearish outlook.

As of 25-May, Poona Dal and Oil Industries Ltd is experiencing a decline in its stock price, currently at 66.10, which reflects a change of -0.3 or -0.45%. This downward movement can be attributed to several factors. <BR><BR>Firstly, the stock has underperformed compared to its sector, with a performance today that is -1.28% lower than the sector average. Additionally, the stock has seen a trend reversal, having fallen after two consecutive days of gains, indicating a potential shift in investor sentiment. <BR><BR>Moreover, the stock's delivery volume has significantly decreased, with a drop of -83.24% against the 5-day average delivery volume, suggesting a reduction in investor participation. While the stock is currently trading above its 5-day, 20-day, 50-day, and 100-day moving averages, it remains below its 200-day moving average, which may signal a longer-term bearish trend.<BR><BR>Overall, the combination of underperformance against the sector, declining investor participation, and the recent trend reversal contributes to the current fall in the stock price of Poona Dal and Oil Industries Ltd.

View full answer
iScoreScore
Click here to find our call on this stock
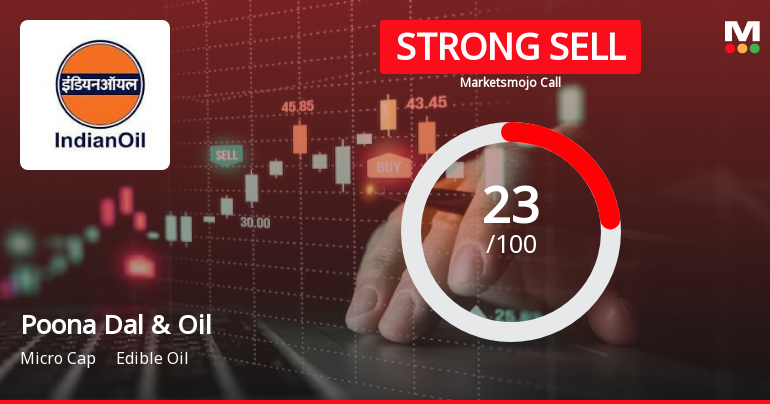
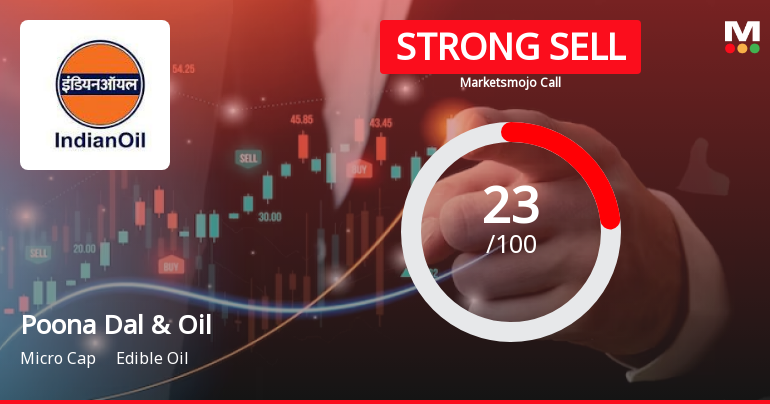
Strong Sell
Sell
Hold
Buy
Strong Buy

Dashboard

1

Weak Long Term Fundamental Strength with a -30.20% CAGR growth in Operating Profits over the last 5 years

  • Company's ability to service its debt is weak with a poor EBIT to Interest (avg) ratio of 0.90
  • The company has been able to generate a Return on Equity (avg) of 2.25% signifying low profitability per unit of shareholders funds
2

Flat results in Mar 26

stock-summaryMojo Parameters

Mojo Parameters

Loading Valuation Snapshot...

Stock DNA

stock-summary
Industry

Edible Oil

stock-summary
Market cap

INR 38 Cr (Micro Cap)

stock-summary
P/E

25.00

stock-summary
Industry P/E

21

stock-summary
Dividend Yield

0.00%

stock-summary
Debt Equity

-0.60

stock-summary
Return on Equity

2.55%

stock-summary
Price to Book

0.65

Revenue and Profits:
Net Sales:
35 Cr
(Quarterly Results - Mar 2026)
Net Profit:
1 Cr
stock-summaryTotal Returns
Total Returns (Price + Dividend) stock-summary
Dividend Yield (0%)
TimePeriod
Price Return
Dividend Return
Total Return
3 Months
1.5%
0%
1.5%
6 Months
-0.86%
0%
-0.86%
1 Year
2.28%
0%
2.28%
2 Years
4.68%
0%
4.68%
3 Years
29.41%
0%
29.41%
4 Years
-9.55%
0%
-9.55%
5 Years
41.6%
0%
41.6%

Latest dividend: 0.9000 per share ex-dividend date: Sep-19-2013

Risk Adjusted Returns v/s stock-summary
Returns Beta
Icon
Beta has not been calculated since enough price history is not available
stock-summaryNews & Corporate Actions

News

Poona Dal and Oil Industries Gains 1.13%: 2 Key Factors Driving the Week

Key Events This Week

May 18: Stock opens strong at Rs.66.78, up 1.71% despite Sensex decline

May 20: Q4 FY26 results reveal marginal growth but operational weaknesses; stock drops 5.33%

May 21: Valuation downgrade to Strong Sell announced amid elevated risk; stock rebounds 4.06%

May 22: Week closes at Rs.66.40, up 2.09% on positive market sentiment

Announcements stock-summary

Announcement under Regulation 30 (LODR)-Change in Directorate

20-May-2026 | Source : BSE

Accepatnce of Resignation of Existing Non Executive Independent Directors Mr Kewalchand Muthiyan Mr Ajinkya Ghogardrae and Mrs Ligy George and Appointment of New Additional Non executive Independent Directors Ms Ankita Agrawal Mr Rupesh Lohade and Mr N V Kadekar in place of them. Also appointment of Mr Satyen Gathani as an additional executive director of the company w.e..f 19th May 2026 subject to approval of members in ensuing Annual General Meeting.

Results For The Year Ended 31.03.2026

19-May-2026 | Source : BSE

Audited Results for the year ended 31.03.2026

Board Meeting Intimation for Approval Of Audited Financial Results For The Quarter And Year Ended 31St March 2026

12-May-2026 | Source : BSE

Poona Dal & Oil Industries Ltdhas informed BSE that the meeting of the Board of Directors of the Company is scheduled on 19/05/2026 inter alia to consider and approve audited financial results for the year ended 31st March 2026

Corporate Actions stock-summary

stock-summary
BOARD MEETING

No Upcoming Board Meetings

stock-summary
DIVIDEND

Poona Dal and Oil Industries Ltd has declared 9% dividend, ex-date: 19 Sep 13

stock-summary
SPLITS

No Splits history available

stock-summary
BONUS

No Bonus history available

stock-summary
RIGHTS

No Rights history available

stock-summaryKey Factors

Quality key factors stock-summary

Factor
Value
Sales Growth (5y)
-2.82%
EBIT Growth (5y)
-30.20%
EBIT to Interest (avg)
0.90
Debt to EBITDA (avg)
1.58
Net Debt to Equity (avg)
-0.60
Sales to Capital Employed (avg)
3.06
Tax Ratio
27.09%
Dividend Payout Ratio
0
Pledged Shares
0
Institutional Holding
0
ROCE (avg)
4.86%
ROE (avg)
2.25%

Valuation key factors

Factor
Value
P/E Ratio
25
Industry P/E
21
Price to Book Value
0.65
EV to EBIT
2.73
EV to EBITDA
2.73
EV to Capital Employed
0.12
EV to Sales
0.02
PEG Ratio
2.44
Dividend Yield
NA
ROCE (Latest)
1.16%
ROE (Latest)
2.55%

Technicals key factors

Indicator
Weekly
Monthly
MACD
Mildly Bullish
Mildly Bearish
RSI
No Signal
No Signal
Bollinger Bands
Mildly Bullish
Mildly Bearish
Moving Averages
Mildly Bearish (Daily)
KST
Mildly Bullish
Mildly Bearish
Dow Theory
No Trend
No Trend
stock-summary Technical Indicator Scale: Bearish, Mildly Bearish, Sideways, Mildly Bullish, Bullish  Turned 
stock-summaryShareholding
Shareholding Snapshot : Mar 2026stock-summary
Shareholding Compare (%holding) stock-summary
Majority shareholders

Promoters

Pledged Promoter Holdings

None

Mutual Funds

Held by 0 Schemes

FIIs

Held by 0 FIIs

Promoter with highest holding

Sudarshanbai Deepchand Parakh (30.75%)

Highest Public shareholder

Sangeetha S (1.3%)

Individual Investors Holdings

26.31%

stock-summaryFinancial
[
  {
    "link": "quarterly",
    "btn_text": "All Quarterly Results",
    "header": "Quarterly Results Snapshot (Standalone) - Mar'26 - QoQ",
    "rhs": [
      {
        "prefix": "Net Sales ",
        "suffix": "QoQ Growth in quarter ended Mar 2026 is -2.96% vs 3.29% in Dec 2025",
        "dir": -1
      },
      {
        "prefix": "Standalone Net Profit ",
        "suffix": "QoQ Growth in quarter ended Mar 2026 is 23.91% vs 76.92% in Dec 2025",
        "dir": -1
      }
    ],
    "table": {
      "header": [
        "Mar'26",
        "Dec'25",
        "Change(%)"
      ],
      "body": [
        {
          "field": "Net Sales",
          "val1": "35.03",
          "val2": "36.10",
          "chgp": "-2.96%",
          "chgp_class": "negative"
        },
        {
          "field": "Operating Profit (PBDIT) excl Other Income",
          "val1": "0.17",
          "val2": "0.16",
          "chgp": "6.25%",
          "chgp_class": "positive"
        },
        {
          "field": "Interest",
          "val1": "0.00",
          "val2": "0.00",
          "chgp": "",
          "chgp_class": "neutral"
        },
        {
          "field": "Exceptional Items",
          "val1": "0.00",
          "val2": "0.00",
          "chgp": "",
          "chgp_class": "neutral"
        },
        {
          "field": "Standalone Net Profit",
          "val1": "0.57",
          "val2": "0.46",
          "chgp": "23.91%",
          "chgp_class": "positive"
        },
        {
          "field": "Operating Profit Margin (Excl OI)",
          "val1": "0.49%",
          "val2": "0.44%",
          "chgp": "0.05%",
          "chgp_class": "positive"
        }
      ]
    }
  },
  {
    "link": "half-yearly",
    "btn_text": "All Half Yearly Results",
    "header": "Half Yearly Results Snapshot (Standalone) - Sep'25",
    "rhs": [
      {
        "prefix": "Net Sales ",
        "suffix": " Growth in half year ended Sep 2025 is -16.10% vs 59.11% in Sep 2024",
        "dir": -1
      },
      {
        "prefix": "Standalone Net Profit ",
        "suffix": " Growth in half year ended Sep 2025 is 0.00% vs 24.32% in Sep 2024",
        "dir": -1
      }
    ],
    "table": {
      "header": [
        "Sep'25",
        "Sep'24",
        "Change(%)"
      ],
      "body": [
        {
          "field": "Net Sales",
          "val1": "69.60",
          "val2": "82.96",
          "chgp": "-16.10%",
          "chgp_class": "negative"
        },
        {
          "field": "Operating Profit (PBDIT) excl Other Income",
          "val1": "0.42",
          "val2": "0.66",
          "chgp": "-36.36%",
          "chgp_class": "negative"
        },
        {
          "field": "Interest",
          "val1": "0.00",
          "val2": "0.00",
          "chgp": "",
          "chgp_class": "neutral"
        },
        {
          "field": "Exceptional Items",
          "val1": "0.00",
          "val2": "0.00",
          "chgp": "",
          "chgp_class": "neutral"
        },
        {
          "field": "Standalone Net Profit",
          "val1": "0.46",
          "val2": "0.46",
          "chgp": "",
          "chgp_class": "neutral"
        },
        {
          "field": "Operating Profit Margin (Excl OI)",
          "val1": "0.60%",
          "val2": "0.80%",
          "chgp": "-0.20%",
          "chgp_class": "negative"
        }
      ]
    }
  },
  {
    "link": "nine-monthly",
    "btn_text": "All Nine Monthly Results",
    "header": "Nine Monthly Results Snapshot (Standalone) - Dec'25",
    "rhs": [
      {
        "prefix": "Net Sales ",
        "suffix": "YoY Growth in nine months ended Dec 2025 is -7.39% vs 51.36% in Dec 2024",
        "dir": -1
      },
      {
        "prefix": "Standalone Net Profit ",
        "suffix": "YoY Growth in nine months ended Dec 2025 is 13.58% vs 50.00% in Dec 2024",
        "dir": -1
      }
    ],
    "table": {
      "header": [
        "Dec'25",
        "Dec'24",
        "Change(%)"
      ],
      "body": [
        {
          "field": "Net Sales",
          "val1": "105.70",
          "val2": "114.14",
          "chgp": "-7.39%",
          "chgp_class": "negative"
        },
        {
          "field": "Operating Profit (PBDIT) excl Other Income",
          "val1": "0.58",
          "val2": "0.70",
          "chgp": "-17.14%",
          "chgp_class": "negative"
        },
        {
          "field": "Interest",
          "val1": "0.00",
          "val2": "0.00",
          "chgp": "",
          "chgp_class": "neutral"
        },
        {
          "field": "Exceptional Items",
          "val1": "0.00",
          "val2": "0.00",
          "chgp": "",
          "chgp_class": "neutral"
        },
        {
          "field": "Standalone Net Profit",
          "val1": "0.92",
          "val2": "0.81",
          "chgp": "13.58%",
          "chgp_class": "positive"
        },
        {
          "field": "Operating Profit Margin (Excl OI)",
          "val1": "0.55%",
          "val2": "0.61%",
          "chgp": "-0.06%",
          "chgp_class": "negative"
        }
      ]
    }
  },
  {
    "link": "annual",
    "btn_text": "All Annual Results",
    "header": "Annual Results Snapshot (Standalone) - Mar'26",
    "rhs": [
      {
        "prefix": "Net Sales ",
        "suffix": "YoY Growth in year ended Mar 2026 is -4.40% vs 49.59% in Mar 2025",
        "dir": -1
      },
      {
        "prefix": "Standalone Net Profit ",
        "suffix": "YoY Growth in year ended Mar 2026 is 10.45% vs 71.79% in Mar 2025",
        "dir": -1
      }
    ],
    "table": {
      "header": [
        "Mar'26",
        "Mar'25",
        "Change(%)"
      ],
      "body": [
        {
          "field": "Net Sales",
          "val1": "140.73",
          "val2": "147.20",
          "chgp": "-4.40%",
          "chgp_class": "negative"
        },
        {
          "field": "Operating Profit (PBDIT) excl Other Income",
          "val1": "0.74",
          "val2": "0.76",
          "chgp": "-2.63%",
          "chgp_class": "negative"
        },
        {
          "field": "Interest",
          "val1": "0.00",
          "val2": "0.00",
          "chgp": "",
          "chgp_class": "neutral"
        },
        {
          "field": "Exceptional Items",
          "val1": "0.00",
          "val2": "0.00",
          "chgp": "",
          "chgp_class": "neutral"
        },
        {
          "field": "Standalone Net Profit",
          "val1": "1.48",
          "val2": "1.34",
          "chgp": "10.45%",
          "chgp_class": "positive"
        },
        {
          "field": "Operating Profit Margin (Excl OI)",
          "val1": "0.53%",
          "val2": "0.52%",
          "chgp": "0.01%",
          "chgp_class": "positive"
        }
      ]
    }
  }
]

Quarterly Results Snapshot (Standalone) - Mar'26 - QoQstock-summary

Mar'26
Dec'25
Change(%)
Net Sales
35.03
36.10
-2.96%
Operating Profit (PBDIT) excl Other Income
0.17
0.16
6.25%
Interest
0.00
0.00
Exceptional Items
0.00
0.00
Standalone Net Profit
0.57
0.46
23.91%
Operating Profit Margin (Excl OI)
0.49%
0.44%
0.05%
Values in Rs Cr.
Direction Arrows
Net Sales

QoQ Growth in quarter ended Mar 2026 is -2.96% vs 3.29% in Dec 2025

Direction Arrows
Standalone Net Profit

QoQ Growth in quarter ended Mar 2026 is 23.91% vs 76.92% in Dec 2025

Half Yearly Results Snapshot (Standalone) - Sep'25stock-summary

Sep'25
Sep'24
Change(%)
Net Sales
69.60
82.96
-16.10%
Operating Profit (PBDIT) excl Other Income
0.42
0.66
-36.36%
Interest
0.00
0.00
Exceptional Items
0.00
0.00
Standalone Net Profit
0.46
0.46
Operating Profit Margin (Excl OI)
0.60%
0.80%
-0.20%
Values in Rs Cr.
Direction Arrows
Net Sales

Growth in half year ended Sep 2025 is -16.10% vs 59.11% in Sep 2024

Direction Arrows
Standalone Net Profit

Growth in half year ended Sep 2025 is 0.00% vs 24.32% in Sep 2024

Nine Monthly Results Snapshot (Standalone) - Dec'25stock-summary

Dec'25
Dec'24
Change(%)
Net Sales
105.70
114.14
-7.39%
Operating Profit (PBDIT) excl Other Income
0.58
0.70
-17.14%
Interest
0.00
0.00
Exceptional Items
0.00
0.00
Standalone Net Profit
0.92
0.81
13.58%
Operating Profit Margin (Excl OI)
0.55%
0.61%
-0.06%
Values in Rs Cr.
Direction Arrows
Net Sales

YoY Growth in nine months ended Dec 2025 is -7.39% vs 51.36% in Dec 2024

Direction Arrows
Standalone Net Profit

YoY Growth in nine months ended Dec 2025 is 13.58% vs 50.00% in Dec 2024

Annual Results Snapshot (Standalone) - Mar'26stock-summary

Mar'26
Mar'25
Change(%)
Net Sales
140.73
147.20
-4.40%
Operating Profit (PBDIT) excl Other Income
0.74
0.76
-2.63%
Interest
0.00
0.00
Exceptional Items
0.00
0.00
Standalone Net Profit
1.48
1.34
10.45%
Operating Profit Margin (Excl OI)
0.53%
0.52%
0.01%
Values in Rs Cr.
Direction Arrows
Net Sales

YoY Growth in year ended Mar 2026 is -4.40% vs 49.59% in Mar 2025

Direction Arrows
Standalone Net Profit

YoY Growth in year ended Mar 2026 is 10.45% vs 71.79% in Mar 2025

stock-summaryCompany CV
About Poona Dal and Oil Industries Ltd stock-summary
stock-summary
Poona Dal and Oil Industries Ltd
Micro Cap
Edible Oil
Poona Dal and Oil Industries Limited, formerly known as Suryaoday Agro Industries Ltd was incorporated in 1993. The name was changed from Suryaoday Agro Industries Limited to Poona Dal and Oil Industries Limited in 1997. The Company is engaged in manufacturing and trading in edible oil and pulses. Oil Division includes oil, by products and others. Agro Division includes pulses, processed pulses, processed pulses flour and others.
Company Coordinates stock-summary
Company Details
71/A Industrial estate, Hadapsar Pune Maharashtra : 411013
stock-summary
Tel: 91-020-26816020/24
stock-summary
pdoil@pdbmgroup.com
Registrar Details
Sharex Dynamic (India) Pvt Ltd , Unit -1, Luthra Ind. Premises , Safed Pool, Andheri-Kurla Road, Andheri (E), Mumbai