
Compare Popular Vehicles with Similar Stocks
Dashboard
Weak Long Term Fundamental Strength with a -48.65% CAGR growth in Operating Profits over the last 5 years
- Low ability to service debt as the company has a high Debt to EBITDA ratio of 8.24 times
- The company has reported losses. Due to this company has reported negative ROE
Underperformed the market in the last 1 year
Stock DNA
Automobiles
INR 757 Cr (Micro Cap)
NA (Loss Making)
27
0.00%
1.59
-5.14%
1.23
Total Returns (Price + Dividend) 
Latest dividend: 0.5 per share ex-dividend date: Sep-17-2024
Risk Adjusted Returns v/s
Returns Beta

News
When is the next results date for Popular Vehicles & Services Ltd?
The next results date for Popular Vehicles & Services Ltd is scheduled for 26 May 2026....
Read full news article
Popular Vehicles & Services Ltd is Rated Sell
Popular Vehicles & Services Ltd is rated 'Sell' by MarketsMOJO, with this rating last updated on 13 Apr 2026. However, the analysis and financial metrics discussed here reflect the stock's current position as of 17 May 2026, providing investors with an up-to-date view of the company’s fundamentals, returns, and market performance.
Read full news article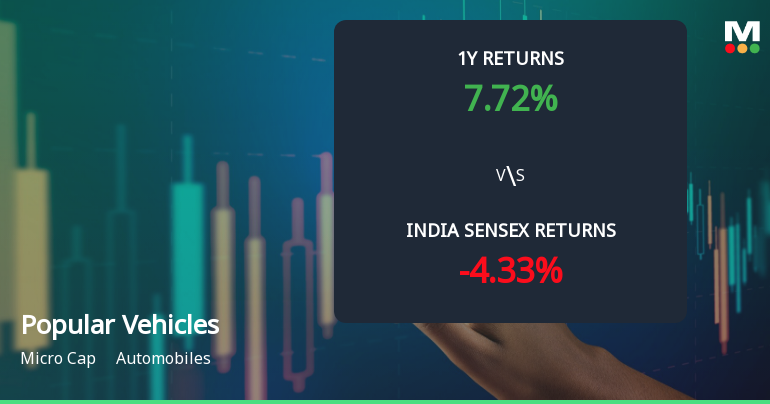
Popular Vehicles & Services Ltd Sees Mixed Technical Signals Amid Mildly Bearish Momentum
Popular Vehicles & Services Ltd, a micro-cap player in the automobile sector, has experienced a notable shift in its technical momentum, moving from a sideways trend to a mildly bearish stance. Despite a recent downgrade in its Mojo Grade from Strong Sell to Sell, the stock exhibits a complex interplay of technical indicators that suggest cautious optimism amid prevailing headwinds.
Read full news article Announcements
Corporate Actions

26 May 2026

Popular Vehicles & Services Ltd has declared 25% dividend, ex-date: 17 Sep 24

No Splits history available

No Bonus history available

No Rights history available
Quality key factors
Valuation key factors
Technicals key factors
 Technical Indicator Scale: Bearish, Mildly Bearish, Sideways, Mildly Bullish, Bullish Turned
 Shareholding Snapshot : Mar 2026
Shareholding Compare (%holding)
Promoters
None
Held by 1 Schemes (9.75%)
Held by 6 FIIs (10.32%)
Naveen Philip (20.39%)
Banyantree Growth Capital Ii Llc (10.01%)
15.07%
Quarterly Results Snapshot (Consolidated) - Dec'25 - QoQ

QoQ Growth in quarter ended Dec 2025 is 16.66% vs 16.74% in Sep 2025
QoQ Growth in quarter ended Dec 2025 is 17.54% vs 106.51% in Sep 2025
Half Yearly Results Snapshot (Consolidated) - Sep'25

Growth in half year ended Sep 2025 is 1.32% vs -1.09% in Sep 2024
Growth in half year ended Sep 2025 is -162.90% vs -67.48% in Sep 2024
Nine Monthly Results Snapshot (Consolidated) - Dec'25
YoY Growth in nine months ended Dec 2025 is 10.98% vs -1.95% in Dec 2024
YoY Growth in nine months ended Dec 2025 is -330.67% vs -94.17% in Dec 2024
Annual Results Snapshot (Consolidated) - Mar'25
YoY Growth in year ended Mar 2025 is -1.32% vs 15.19% in Mar 2024
YoY Growth in year ended Mar 2025 is -113.75% vs 18.75% in Mar 2024
About Popular Vehicles & Services Ltd

Company Coordinates


