
Compare Power & Instrum. with Similar Stocks
Stock DNA
Other Electrical Equipment
INR 214 Cr (Micro Cap)
15.00
35
0.17%
0.06
9.40%
1.35
Total Returns (Price + Dividend) 
Latest dividend: 0.2 per share ex-dividend date: Sep-19-2025
Risk Adjusted Returns v/s
Returns Beta

News

Power & Instrumentation (Gujarat) Ltd is Rated Sell
Power & Instrumentation (Gujarat) Ltd is rated Sell by MarketsMOJO, with this rating last updated on 01 June 2026. However, the analysis and financial metrics discussed here reflect the stock’s current position as of 11 June 2026, providing investors with the latest insights into its performance and outlook.
Read full news articleAre Power & Instrumentation (Gujarat) Ltd latest results good or bad?
Power & Instrumentation (Gujarat) Ltd reported its financial results for Q4 FY26, revealing a mixed performance characterized by both growth and challenges. The company achieved consolidated net profit of ₹3.63 crores, reflecting a year-on-year growth of 29.18%. However, this figure represented a significant quarter-on-quarter decline of 23.21% from ₹4.71 crores in Q3 FY26, raising concerns about the sustainability of profit margins amid rising operational costs. Net sales for the quarter reached ₹58.53 crores, which marked a sequential increase of 20.28% from ₹48.66 crores in Q3 FY26 and a year-on-year growth of 6.24% from ₹55.09 crores in Q4 FY25. This topline growth, however, did not translate into improved profitability, as the operating margin decreased to 10.95%, down from 12.19% in the previous quarter. The decline in operating margin indicates mounting cost pressures that the company is facing, des...
Read full news article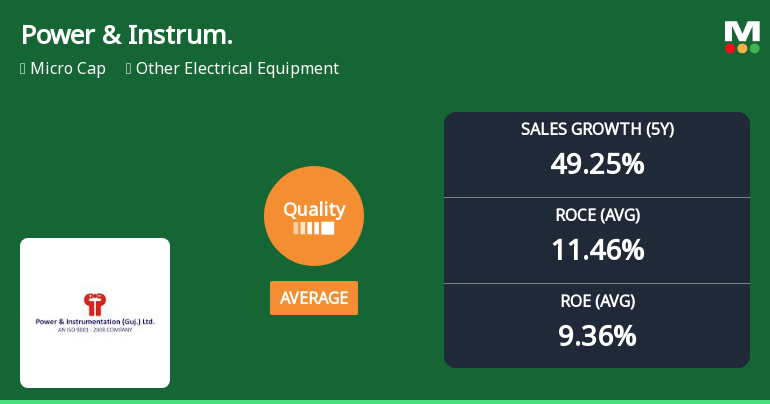
Power & Instrumentation (Gujarat) Ltd Downgraded as Quality Parameters Weaken
Power & Instrumentation (Gujarat) Ltd, a micro-cap player in the Other Electrical Equipment sector, has recently seen its quality grade downgraded from good to average as of 1 Dec 2025. This shift reflects notable changes in the company’s business fundamentals, including profitability metrics, debt levels, and operational consistency. Our comprehensive analysis explores these developments in detail, providing investors with a clear understanding of the evolving risk-reward profile.
Read full news article Announcements
Announcement under Regulation 30 (LODR)-Newspaper Publication
01-Jun-2026 | Source : BSEPFA
Announcement under Regulation 30 (LODR)-Award_of_Order_Receipt_of_Order
28-May-2026 | Source : BSEReceipt of the Order from Ajmer Viduyt Vitran Nigam Limited
Board Meeting Intimation for Board Meeting To Be Held On 30Th May 2026
25-May-2026 | Source : BSEPower And Instrumentation (Gujarat) Ltdhas informed BSE that the meeting of the Board of Directors of the Company is scheduled on 30/05/2026 inter alia to consider and approve 1. To Consider and Approve Audited Financial Results (Standalone & Consolidated) of the Company for the Quarter and Year ended on March 31 2026 as per regulation 33 of SEBI (Listing Obligations and Disclosure Requirements) Regulations 2015; and Any other item with the permission of the Chair and Majority of Directors.
Corporate Actions

No Upcoming Board Meetings

Power & Instrumentation (Gujarat) Ltd has declared 2% dividend, ex-date: 19 Sep 25

No Splits history available

No Bonus history available

No Rights history available
Quality key factors
Valuation key factors
Technicals key factors
 Technical Indicator Scale: Bearish, Mildly Bearish, Sideways, Mildly Bullish, Bullish Turned
 Shareholding Snapshot : Mar 2026
Shareholding Compare (%holding)
Promoters
None
Held by 0 Schemes
Held by 1 FIIs (0.01%)
Padmaraj Padmnabhan Pillai (15.4%)
Kashee Innovation (1.89%)
37.68%
Quarterly Results Snapshot (Consolidated) - Mar'26 - YoY

YoY Growth in quarter ended Mar 2026 is 6.24% vs 49.21% in Mar 2025

YoY Growth in quarter ended Mar 2026 is 29.18% vs 4.85% in Mar 2025
Half Yearly Results Snapshot (Consolidated) - Sep'25
Growth in half year ended Sep 2025 is 38.80% vs 73.67% in Sep 2024
Growth in half year ended Sep 2025 is 27.26% vs 141.00% in Sep 2024
Nine Monthly Results Snapshot (Consolidated) - Dec'25
YoY Growth in nine months ended Dec 2025 is 40.86% vs 85.22% in Dec 2024
YoY Growth in nine months ended Dec 2025 is 18.99% vs 177.95% in Dec 2024
Annual Results Snapshot (Consolidated) - Mar'26
YoY Growth in year ended Mar 2026 is 29.57% vs 73.19% in Mar 2025
YoY Growth in year ended Mar 2026 is 22.62% vs 99.32% in Mar 2025
About Power & Instrumentation (Gujarat) Ltd

Company Coordinates


