
Compare Prakash Pipes with Similar Stocks
Dashboard
Poor long term growth as Net Sales has grown by an annual rate of 10.62% and Operating profit at 0.64% over the last 5 years
The company has declared Negative results for the last 5 consecutive quarters
Despite the size of the company, domestic mutual funds hold only 0.01% of the company
Underperformed the market in the last 1 year
Stock DNA
Plastic Products - Industrial
INR 573 Cr (Micro Cap)
13.00
36
1.43%
-0.08
9.04%
1.18
Total Returns (Price + Dividend) 
Latest dividend: 1 per share ex-dividend date: Dec-24-2025
Risk Adjusted Returns v/s
Returns Beta

News
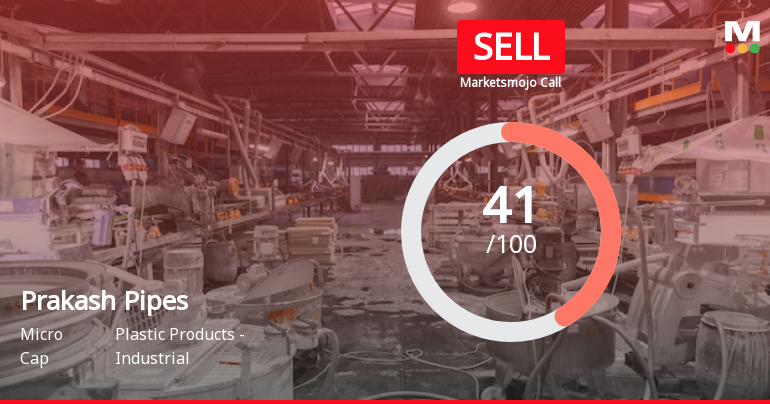
Prakash Pipes Ltd. is Rated Sell by MarketsMOJO
Prakash Pipes Ltd. is rated Sell by MarketsMOJO, with this rating last updated on 02 June 2026. While the rating change occurred on that date, the analysis and financial metrics discussed here reflect the stock’s current position as of 04 June 2026, providing investors with the most up-to-date view of the company’s fundamentals, returns, and technical outlook.
Read full news article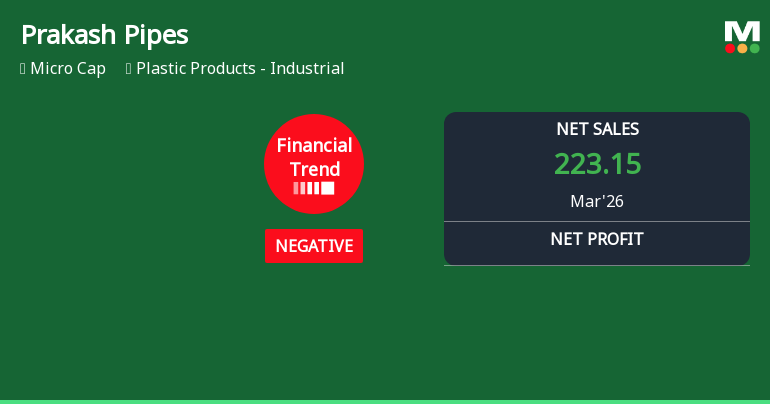
Prakash Pipes Ltd. Reports Mixed Quarterly Results Amid Negative Financial Trend
Prakash Pipes Ltd., a micro-cap player in the Plastic Products - Industrial sector, posted its highest quarterly net sales and earnings per share in the March 2026 quarter, yet faced margin contraction and deteriorating return metrics, signalling a challenging operating environment despite top-line growth.
Read full news article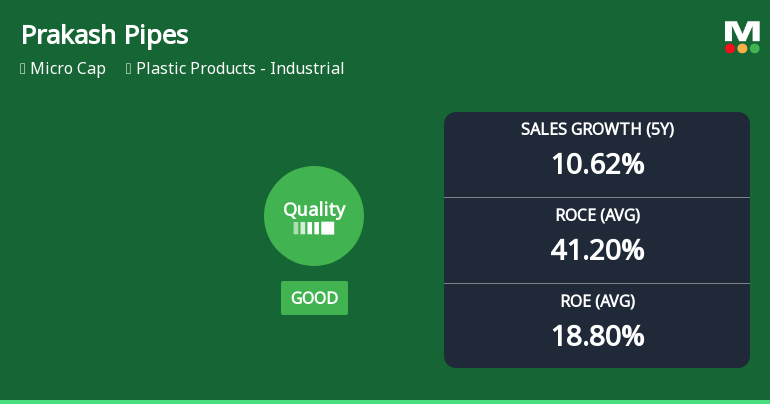
Prakash Pipes Ltd. Quality Upgrade Signals Improved Business Fundamentals Amid Market Challenges
Prakash Pipes Ltd. has seen its quality rating upgraded from average to good, reflecting notable improvements in key business fundamentals such as return on equity (ROE), return on capital employed (ROCE), and debt management. Despite a challenging market environment and a sharp decline in share price, the company’s underlying financial metrics suggest a strengthening operational profile that investors should carefully consider.
Read full news article Announcements
Prakash Pipes Limited - Press Release
04-Nov-2019 | Source : NSEPrakash Pipes Limited has informed the Exchange regarding a press release dated November 04, 2019, titled "Prakash Pipes Limited doubles its Capacity in Flexible Packaging Division".
Prakash Pipes Limited - Press Release
31-Oct-2019 | Source : NSEPrakash Pipes Limited has informed the Exchange regarding a press release dated October 31, 2019, titled "PRESS RELEASE -31.10.2019".
Corporate Actions

No Upcoming Board Meetings

Prakash Pipes Ltd. has declared 10% dividend, ex-date: 24 Dec 25

No Splits history available

No Bonus history available

No Rights history available
Quality key factors
Valuation key factors
Technicals key factors
 Technical Indicator Scale: Bearish, Mildly Bearish, Sideways, Mildly Bullish, Bullish Turned
 Shareholding Snapshot : Mar 2026
Shareholding Compare (%holding)
Non Institution
None
Held by 5 Schemes (0.01%)
Held by 7 FIIs (0.43%)
Ved Prakash Agarwal (19.11%)
Mukul Mahavir Agrawal (2.36%)
42.87%
Quarterly Results Snapshot (Standalone) - Mar'26 - QoQ

QoQ Growth in quarter ended Mar 2026 is 23.19% vs 0.09% in Dec 2025
QoQ Growth in quarter ended Mar 2026 is 33.33% vs 8.01% in Dec 2025
Half Yearly Results Snapshot (Standalone) - Sep'25

Growth in half year ended Sep 2025 is -5.09% vs 16.92% in Sep 2024
Growth in half year ended Sep 2025 is -60.42% vs 20.81% in Sep 2024
Nine Monthly Results Snapshot (Standalone) - Dec'25
YoY Growth in nine months ended Dec 2025 is -5.35% vs 18.41% in Dec 2024
YoY Growth in nine months ended Dec 2025 is -59.10% vs 13.27% in Dec 2024
Annual Results Snapshot (Standalone) - Mar'26
YoY Growth in year ended Mar 2026 is 1.05% vs 16.60% in Mar 2025
YoY Growth in year ended Mar 2026 is -47.94% vs -7.30% in Mar 2025
About Prakash Pipes Ltd.

Company Coordinates


