
Compare Prakash Woollen with Similar Stocks
Dashboard
Weak Long Term Fundamental Strength with a -17.81% CAGR growth in Operating Profits over the last 5 years
- Low ability to service debt as the company has a high Debt to EBITDA ratio of 6.40 times
- The company has reported losses. Due to this company has reported negative ROE
Underperformed the market in the last 1 year
Stock DNA
Garments & Apparels
INR 25 Cr (Micro Cap)
NA (Loss Making)
23
0.00%
0.83
-2.84%
0.50
Total Returns (Price + Dividend) 
Prakash Woollen for the last several years.
Risk Adjusted Returns v/s
Returns Beta

News
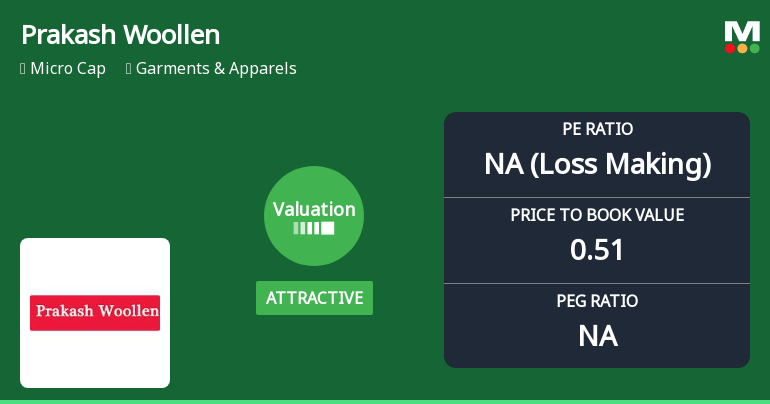
Prakash Woollen & Synthetic Mills Ltd: Valuation Shifts Signal Price Attractiveness Amid Mixed Returns
Prakash Woollen & Synthetic Mills Ltd has undergone a notable change in its valuation parameters, shifting from a risky to an attractive price level. This transformation is underscored by a dramatic drop in its price-to-earnings (P/E) ratio and a favourable price-to-book value (P/BV) metric, positioning the micro-cap garment and apparel company as a potentially compelling investment opportunity despite recent operational challenges.
Read full news articleAre Prakash Woollen & Synthetic Mills Ltd latest results good or bad?
Prakash Woollen & Synthetic Mills Ltd's latest financial results for Q4 FY26 reveal a complex picture characterized by significant operational challenges. The company reported a net profit of ₹1.45 crore, which reflects a substantial decline of 80.72% year-on-year. In contrast, revenue for the same quarter surged to ₹11.88 crore, marking a year-on-year increase of 98.99%. However, this growth is somewhat misleading due to an exceptionally low base from the previous year, as revenue fell sharply by 76.75% compared to the preceding quarter. The operating profit margin improved to 9.85%, recovering from a loss of -11.22% in Q4 FY25, indicating some progress in cost management. However, the absolute operating profit remains low at ₹1.17 crore, raising concerns about the company's ability to generate sustainable profits. The profit before tax was positively impacted by an extraordinary tax credit, leading to a ...
Read full news article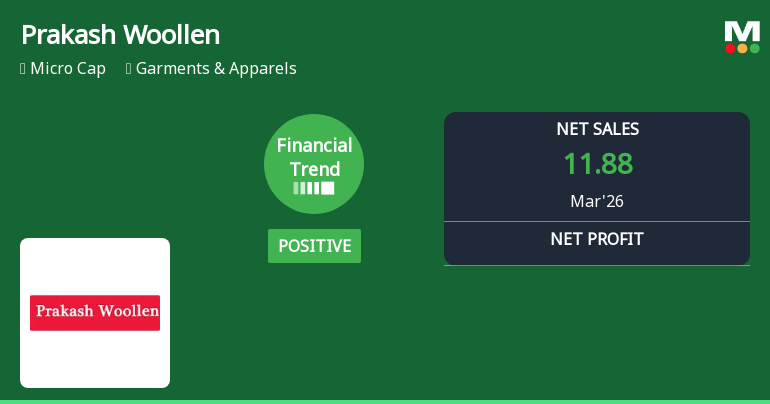
Prakash Woollen & Synthetic Mills Ltd Reports Strong Quarterly Growth Amid Challenging Market
Prakash Woollen & Synthetic Mills Ltd has demonstrated a notable turnaround in its financial performance for the quarter ended March 2026, posting robust revenue growth and improved profitability metrics that contrast with its historical trend of stagnation. Despite a challenging market environment and a micro-cap status, the garment and apparel company’s recent results signal a positive shift in operational momentum.
Read full news article Announcements
Intimation Under Regulation 30 Of The Securities And Exchange Board Of India (Listing Obligations And Disclosure Requirements) Regulations 2015-Enhanced Compensation
06-Jun-2026 | Source : BSEIntimation under reg.30-Enhanced Compensation
Announcement under Regulation 30 (LODR)-Newspaper Publication
01-Jun-2026 | Source : BSENewspaper Publication of Financial Results for the quarter and year ended on 31.03.2026
Board Meeting Outcome for Outcome Of The Meeting Of The Board Of Directors Held Today On 30Th May 2026 As Per The Regulation 30 &33 Of The SEBI (Listing Obligations And Disclosure Requirements) Regulations 2015
30-May-2026 | Source : BSEOutcome of Board Meeting 30.05.2026
Corporate Actions

No Upcoming Board Meetings

No Dividend history available

No Splits history available

No Bonus history available

No Rights history available
Quality key factors
Valuation key factors
Technicals key factors
 Technical Indicator Scale: Bearish, Mildly Bearish, Sideways, Mildly Bullish, Bullish Turned
 Shareholding Snapshot : Mar 2026
Shareholding Compare (%holding)
Promoters
None
Held by 1 Schemes (0.13%)
Held by 0 FIIs
Adeep Gupta Huf (6.52%)
Narveer Yadav (3.23%)
31.89%
Quarterly Results Snapshot (Standalone) - Mar'26 - YoY

YoY Growth in quarter ended Mar 2026 is 98.99% vs -49.58% in Mar 2025

YoY Growth in quarter ended Mar 2026 is -80.72% vs 817.07% in Mar 2025
Half Yearly Results Snapshot (Standalone) - Sep'25
Growth in half year ended Sep 2025 is 2.73% vs 1.76% in Sep 2024
Growth in half year ended Sep 2025 is 64.12% vs 17.61% in Sep 2024
Nine Monthly Results Snapshot (Standalone) - Dec'25
YoY Growth in nine months ended Dec 2025 is -4.87% vs -24.67% in Dec 2024
YoY Growth in nine months ended Dec 2025 is 62.84% vs -332.41% in Dec 2024
Annual Results Snapshot (Standalone) - Mar'26
YoY Growth in year ended Mar 2026 is 1.03% vs 2.98% in Mar 2025
YoY Growth in year ended Mar 2026 is -170.63% vs 31.25% in Mar 2025
About Prakash Woollen & Synthetic Mills Ltd

Company Coordinates


