
Compare Praxis Home with Similar Stocks
Dashboard
With a Operating Losses, the company has a Weak Long Term Fundamental Strength
- Poor long term growth as Net Sales has grown by an annual rate of -21.11% over the last 5 years
- High Debt Company with a Debt to Equity ratio (avg) of 59.01 times
The company has declared Negative results for the last 15 consecutive quarters
Risky - Negative EBITDA
Below par performance in long term as well as near term
Stock DNA
Garments & Apparels
INR 120 Cr (Micro Cap)
NA (Loss Making)
69
0.00%
2.38
-118.05%
2.48
Total Returns (Price + Dividend) 
Praxis Home for the last several years.
Risk Adjusted Returns v/s
Returns Beta

News

Praxis Home Retail Ltd is Rated Strong Sell
Praxis Home Retail Ltd is rated Strong Sell by MarketsMOJO, with this rating last updated on 12 Nov 2024. However, the analysis and financial metrics discussed here reflect the company’s current position as of 30 July 2026, providing investors with an up-to-date view of its fundamentals, returns, and market standing.
Read full news article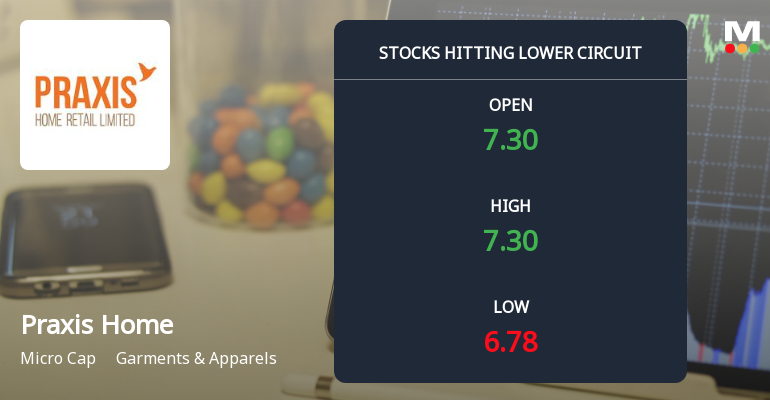
Praxis Home Retail Ltd Locks at Lower Circuit With 2.44% Loss — Sellers Queue, No Buyers in Sight
At Rs 6.62, sellers were still queuing — but there were no buyers willing to take the other side. Praxis Home Retail Ltd locked at its lower circuit of 2.44% on 29 Jul 2026, with unfilled sell orders and a frozen price in the small-cap segment.
Read full news article
Praxis Home Retail Ltd Locks at Lower Circuit With 3.12% Loss — Sellers Queue, No Buyers in Sight
At Rs 7.14, sellers were still queuing — but there were no buyers willing to take the other side. Praxis Home Retail Ltd locked at its lower circuit of 3.12% on 20 Jul 2026, with unfilled sell orders and a frozen price, reflecting persistent selling pressure in a micro-cap stock with limited liquidity.
Read full news article Announcements
Praxis Home Retail Limited - Other General Purpose
21-Nov-2019 | Source : NSEPraxis Home Retail Limited has informed the Exchange that In terms of Regulation 23(9) of the Securities and Exchange Board of India (Listing Obligations and Disclosure Requirements) Regulations, 2015, the Company has submitted a copy of disclosure of Related Party Transactions of the Company on a consolidated basis for the half year ended September 30, 2019.
Praxis Home Retail Limited - Outcome of Board Meeting
08-Nov-2019 | Source : NSEPraxis Home Retail Limited has informed the Exchange regarding Board meeting held on November 07, 2019.
Praxis Home Retail Limited - Shareholders meeting
31-Oct-2019 | Source : NSEPraxis Home Retail Limited has informed the Exchange regarding Proceedings of Extraordinary General Meeting held on October 30, 2019. Further, the company has submitted the Exchange a copy of Srutinizers report along with voting results.
Corporate Actions

No Upcoming Board Meetings

No Dividend history available

No Splits history available

No Bonus history available

Praxis Home Retail Ltd has announced 11:30 rights issue, ex-date: 20 Mar 25
Quality key factors
Valuation key factors
Technicals key factors
 Technical Indicator Scale: Bearish, Mildly Bearish, Sideways, Mildly Bullish, Bullish Turned
 Shareholding Snapshot : Jun 2026
Shareholding Compare (%holding)
Non Institution
None
Held by 1 Schemes (0.0%)
Held by 2 FIIs (1.37%)
Surplus Finvest Private Limited (3.24%)
Elimath Advisors Private Limited (12.85%)
48.35%
Quarterly Results Snapshot (Standalone) - Mar'26 - YoY

YoY Growth in quarter ended Mar 2026 is -9.04% vs -41.10% in Mar 2025

YoY Growth in quarter ended Mar 2026 is -701.25% vs 57.06% in Mar 2025
Half Yearly Results Snapshot (Standalone) - Sep'25
Growth in half year ended Sep 2025 is -22.64% vs -47.14% in Sep 2024
Growth in half year ended Sep 2025 is 626.67% vs 63.57% in Sep 2024
Nine Monthly Results Snapshot (Standalone) - Dec'25
YoY Growth in nine months ended Dec 2025 is -22.72% vs -47.08% in Dec 2024
YoY Growth in nine months ended Dec 2025 is 336.43% vs 60.56% in Dec 2024
Annual Results Snapshot (Standalone) - Mar'26
YoY Growth in year ended Mar 2026 is -19.59% vs -45.82% in Mar 2025
YoY Growth in year ended Mar 2026 is -90.42% vs 59.19% in Mar 2025
About Praxis Home Retail Ltd

Company Coordinates


