
Compare Precipio, Inc. with Similar Stocks
Stock DNA
Pharmaceuticals & Biotechnology
USD 43 Million (Micro Cap)
NA (Loss Making)
NA
0.00%
-0.12
-10.16%
3.15
Total Returns (Price + Dividend) 
Precipio, Inc. for the last several years.
Risk Adjusted Returns v/s
News
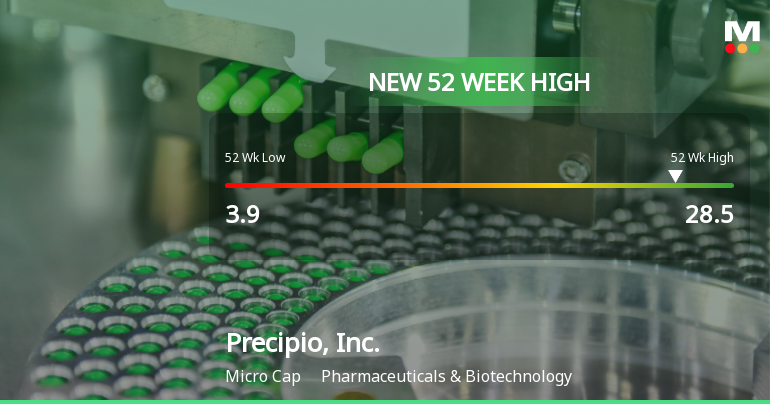
Precipio, Inc. Hits New 52-Week High of $28.50, Up 345.57%
Precipio, Inc., a microcap in the Pharmaceuticals & Biotechnology sector, achieved a new 52-week high of USD 28.50, reflecting a significant year-over-year performance increase. With a market cap of USD 34 million, the company shows resilience despite being currently loss-making, as indicated by its financial metrics.
Read full news article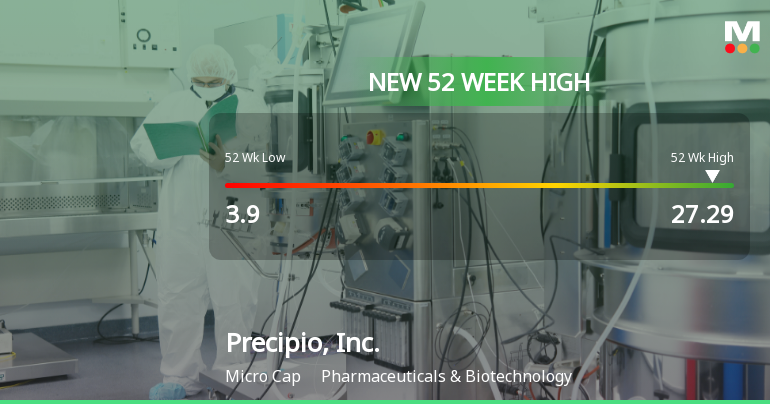
Precipio, Inc. Hits New 52-Week High of $27.29, Up 356.52%
Precipio, Inc., a microcap company in the Pharmaceuticals & Biotechnology sector, achieved a new 52-week high of USD 27.29 on November 19, 2025, reflecting a substantial year-over-year gain. Despite its current losses and competitive challenges, the milestone highlights the company's notable market activity and performance.
Read full news article Announcements

Corporate Actions
Quality key factors
Valuation key factors
Technicals key factors
 Technical Indicator Scale: Bearish, Mildly Bearish, Sideways, Mildly Bullish, Bullish Turned
 Shareholding Snapshot : Sep 2025
Shareholding Compare (%holding)
Domestic Funds
Held in 3 Schemes (2.65%)
Held by 1 Foreign Institutions (0.0%)
Quarterly Results Snapshot (Consolidated) - Sep'25 - QoQ

QoQ Growth in quarter ended Sep 2025 is 19.30% vs 16.33% in Jun 2025

QoQ Growth in quarter ended Sep 2025 is -200.00% vs 111.11% in Jun 2025
Annual Results Snapshot (Consolidated) - Dec'24
YoY Growth in year ended Dec 2024 is 21.71% vs 61.70% in Dec 2023
YoY Growth in year ended Dec 2024 is 27.12% vs 51.64% in Dec 2023
About Precipio, Inc.

Company Coordinates


