
Compare Premier Energies with Similar Stocks
Dashboard
Strong Long Term Fundamental Strength with an average Return on Equity (ROE) of 34.13%
- Healthy long term growth as Net Sales has grown by an annual rate of 57.80% and Operating profit at 124.56%
- Strong ability to service debt as the company has a low Debt to EBITDA ratio of 1.56 times
The company has declared Positive results for the last 6 consecutive quarters
Company is among the highest 1% of companies rated by MarketsMojo across all 4,000 stocks
Stock DNA
Other Electrical Equipment
INR 45,425 Cr (Mid Cap)
30.00
30
0.12%
0.28
35.05%
10.91
Total Returns (Price + Dividend) 
Latest dividend: 0.7487783810463969 per share ex-dividend date: May-08-2026
Risk Adjusted Returns v/s
Returns Beta

News
When is the next results date for Premier Energies Ltd?
The next results date for Premier Energies Ltd is scheduled for 06 August 2026....
Read full news article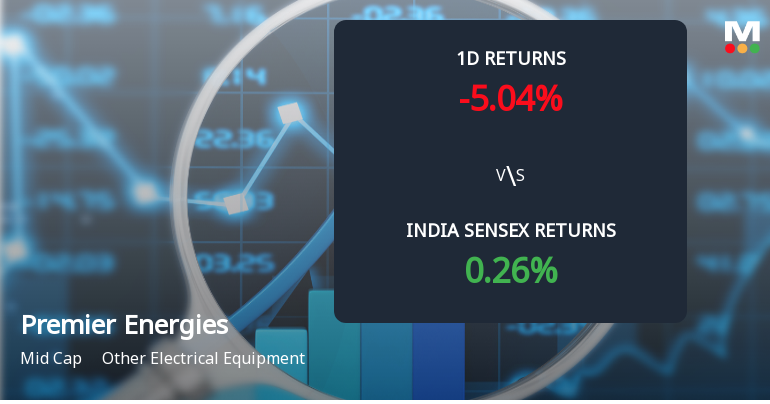
Premier Energies Ltd Sees Sharp Open Interest Surge Amid Mixed Market Signals
Premier Energies Ltd, a mid-cap player in the Other Electrical Equipment sector, witnessed a significant 26.8% surge in open interest (OI) in its derivatives segment on 30 Jul 2026, signalling heightened market activity and shifting investor positioning despite the stock’s underperformance relative to its sector and broader indices.
Read full news article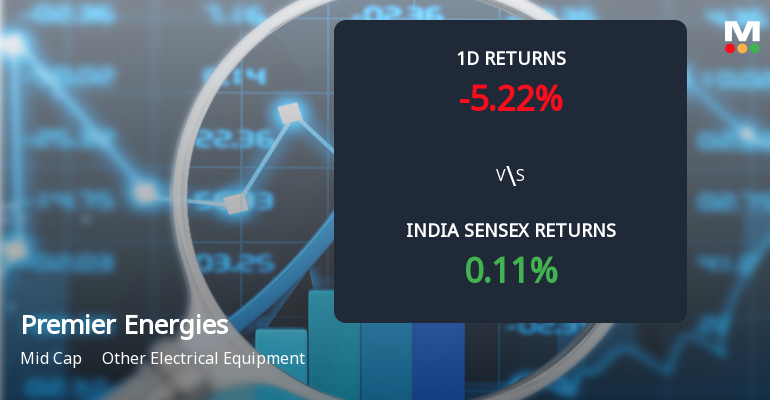
Premier Energies Ltd Sees Sharp Open Interest Surge Amid Mixed Price Action
Premier Energies Ltd, a mid-cap player in the Other Electrical Equipment sector, witnessed a significant 20.96% surge in open interest (OI) in its derivatives segment on 30 Jul 2026, signalling heightened market activity despite the stock’s underperformance with a 5.13% decline in price. This divergence between rising OI and falling price raises important questions about market positioning and potential directional bets among traders.
Read full news article Announcements
Corporate Actions

06 Aug 2026

Premier Energies Ltd has declared 75% dividend, ex-date: 08 May 26

No Splits history available

No Bonus history available

No Rights history available
Quality key factors
Valuation key factors
Technicals key factors
 Technical Indicator Scale: Bearish, Mildly Bearish, Sideways, Mildly Bullish, Bullish Turned
 Shareholding Snapshot : Jun 2026
Shareholding Compare (%holding)
Promoters
None
Held by 29 Schemes (12.91%)
Held by 163 FIIs (7.92%)
Chiranjeev Singh Saluja (57.19%)
South Asia Growth Fund Ii Holdings, Llc (5.52%)
4.94%
Quarterly Results Snapshot (Consolidated) - Mar'26 - QoQ

QoQ Growth in quarter ended Mar 2026 is 15.17% vs 5.42% in Dec 2025
QoQ Growth in quarter ended Mar 2026 is 16.62% vs 10.83% in Dec 2025
Half Yearly Results Snapshot (Consolidated) - Sep'25

Growth in half year ended Sep 2025 is 14.85% vs 144.08% in Sep 2024
Growth in half year ended Sep 2025 is 63.63% vs 380.00% in Sep 2024
Nine Monthly Results Snapshot (Consolidated) - Dec'25
YoY Growth in nine months ended Dec 2025 is 14.21% vs 142.81% in Dec 2024
YoY Growth in nine months ended Dec 2025 is 59.70% vs 417.49% in Dec 2024
Annual Results Snapshot (Consolidated) - Mar'26
YoY Growth in year ended Mar 2026 is 20.03% vs 107.35% in Mar 2025
YoY Growth in year ended Mar 2026 is 61.11% vs 305.05% in Mar 2025
About Premier Energies Ltd

Company Coordinates


