
Compare Prime Fresh with Similar Stocks
Dashboard
High Management Efficiency with a high ROE of 39.30%
Company has a Debt to Equity ratio (avg) of 0.09 times
Healthy long term growth as Net Sales has grown by an annual rate of 32.90%
With a growth in Net Profit of 38.83%, the company declared Very Positive results in Mar 26
With ROE of 13.8, it has a Expensive valuation with a 3.6 Price to Book Value
Market Beating Performance
Stock DNA
Other Agricultural Products
INR 314 Cr (Micro Cap)
24.00
33
0.00%
0.01
13.82%
3.56
Total Returns (Price + Dividend) 
Latest dividend: 0.5 per share ex-dividend date: Sep-20-2024
Risk Adjusted Returns v/s
Returns Beta

News
Prime Fresh Ltd is Rated Hold
Prime Fresh Ltd is rated 'Hold' by MarketsMOJO, with this rating last updated on 23 April 2026. However, the analysis and financial metrics discussed here reflect the company’s current position as of 11 June 2026, providing investors with the latest insights into its performance and outlook.
Read full news article
Prime Fresh Ltd is Rated Hold by MarketsMOJO
Prime Fresh Ltd is rated 'Hold' by MarketsMOJO, with this rating last updated on 23 Apr 2026. However, the analysis and financial metrics discussed below reflect the company’s current position as of 27 May 2026, providing investors with an up-to-date perspective on the stock’s fundamentals, valuation, financial trends, and technical outlook.
Read full news article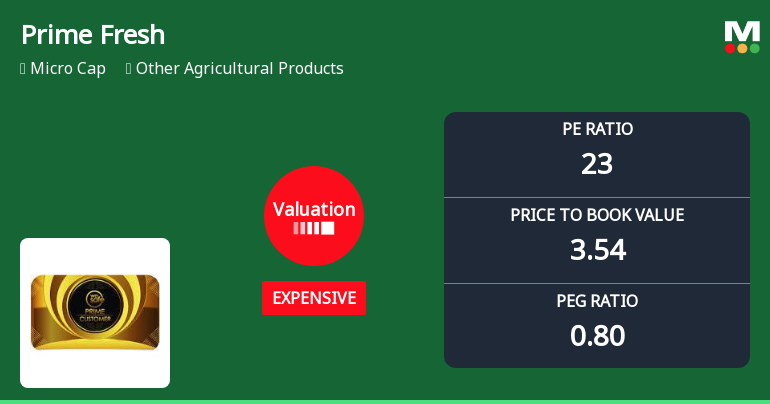
Prime Fresh Ltd Valuation Shifts Signal Changing Market Sentiment
Prime Fresh Ltd, a micro-cap player in the Other Agricultural Products sector, has seen a notable shift in its valuation parameters, prompting a downgrade in its mojo grade from Buy to Hold. With its price-to-earnings (P/E) ratio rising to 23.00 and price-to-book value (P/BV) climbing to 3.54, the stock now trades at a premium compared to its historical averages and peer group, raising questions about its price attractiveness amid mixed market returns.
Read full news article Announcements
Announcement under Regulation 30 (LODR)-Press Release / Media Release
23-May-2026 | Source : BSEPress Release respect to Audited Financial Results for the quarter and year ended 31st March 2026.
Announcement under Regulation 30 (LODR)-Newspaper Publication
22-May-2026 | Source : BSEPublication of Audited Standalone and Consolidated Financial Results of the Company for the quarter and year ended on 31.03.2026.
Compliances-Reg.24(A)-Annual Secretarial Compliance
21-May-2026 | Source : BSESubmission of Annual Secretarial Compliance Report for the Year ended on March 31 2026
Corporate Actions

No Upcoming Board Meetings

Prime Fresh Ltd has declared 5% dividend, ex-date: 20 Sep 24

No Splits history available

Prime Fresh Ltd has announced 2:1 bonus issue, ex-date: 06 May 21

No Rights history available
Quality key factors
Valuation key factors
Technicals key factors
 Technical Indicator Scale: Bearish, Mildly Bearish, Sideways, Mildly Bullish, Bullish Turned
 Shareholding Snapshot : Mar 2026
Shareholding Compare (%holding)
Promoters
8.89
Held by 0 Schemes
Held by 0 FIIs
Hiren Chandrakant Ghelani (30.82%)
Kulin Shantilal Vora (2.96%)
40.65%
Quarterly Results Snapshot (Standalone) - Mar'26 - YoY
Not Applicable: The company has declared_date for only one period
Not Applicable: The company has declared_date for only one period
Half Yearly Results Snapshot (Consolidated) - Sep'25

Growth in half year ended Sep 2025 is 10.07% vs 11.03% in Mar 2025

Growth in half year ended Sep 2025 is 60.88% vs -34.00% in Mar 2025
Nine Monthly Results Snapshot (Consolidated) - Dec'25
YoY Growth in nine months ended Dec 2025 is 27.37% vs 5.04% in Dec 2024
YoY Growth in nine months ended Dec 2025 is 41.72% vs 27.13% in Dec 2024
Annual Results Snapshot (Consolidated) - Mar'26
YoY Growth in year ended Mar 2026 is 32.50% vs 38.58% in Mar 2025
YoY Growth in year ended Mar 2026 is 44.85% vs 30.85% in Mar 2025
About Prime Fresh Ltd

Company Coordinates


