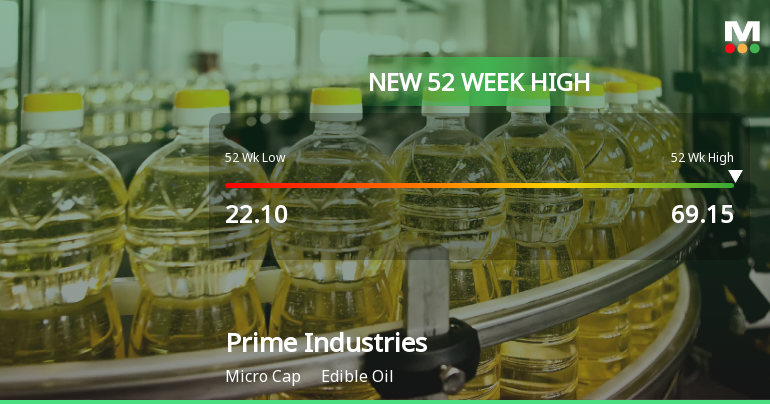
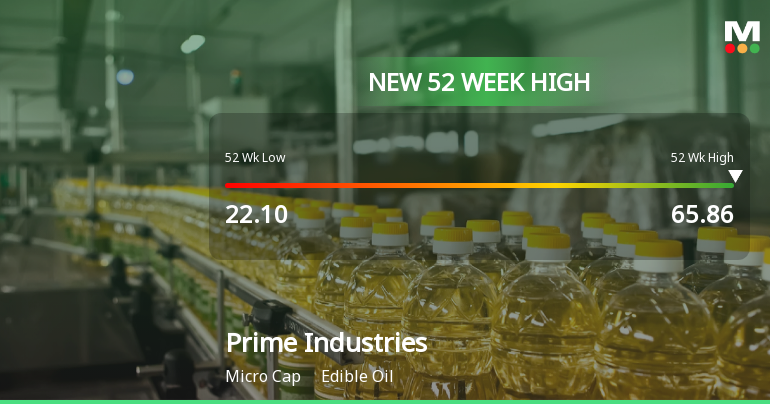
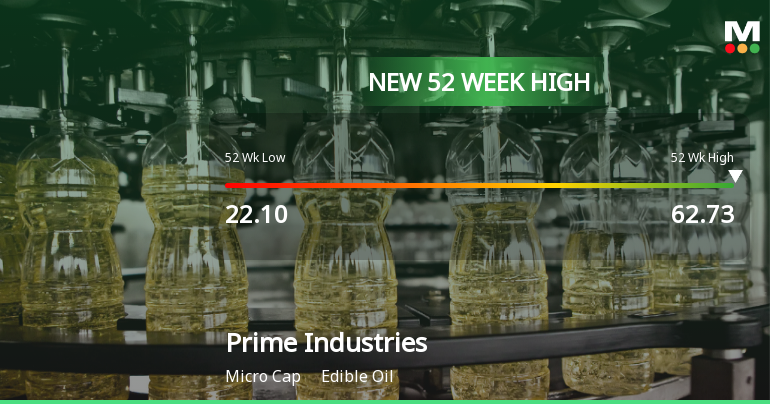
Prime Industries

  • Market Cap: Micro Cap
  • Industry: Edible Oil
  • ISIN: INE543F01028
  • NSEID:
  • BSEID: 519299
INR
38.35
-1.54 (-3.86%)
BSENSE

Aug 07, 03:30 PM

BSE+NSE Vol: 169

  • Price Points
  • Score
  • Mojo Parameters
  • Total Return
  • News and Corporate Actions
  • Key factors
  • Shareholding
  • Financials
  • CompanyCV
stock-recommendationUpcoming Result: Prime Industries will declare its result soon on 10 Aug 2026
stock-recommendationMojo Score Change: Prime Industries has changed its score on 03 Aug 2026. Click here to unlock latest mojo score!
stock-summaryPrice Point
High/Low

1Day

52 Week

Valuation
Technical
Day's Volume

CASH

169 (-98.03%) Volume

Shareholding (Jun 2026)

FII

0.00%

Held by 0 FIIs

DII

0.97%

Held by 0 DIIs

Promoter

26.07%

Why is Prime Industries Ltd falling/rising?

09-Aug-2026

As of 08-Aug, Prime Industries Ltd's stock price is Rs 38.35, down 3.86% and has declined for eight consecutive days, totaling a 13.68% drop. Despite strong financial growth, the stock has underperformed significantly, trading below its moving averages and experiencing decreased investor interest.

As of 08-Aug, Prime Industries Ltd is experiencing a decline in its stock price, currently at Rs 38.35, reflecting a change of -1.54 (-3.86%). The stock has been on a downward trend, having fallen consecutively for the last eight days, resulting in a total decline of -13.68% during this period. This consistent underperformance is evident as the stock has underperformed the sector by -4.99% today and has shown significant losses over various time frames, including -11.64% over the past week and -12.64% over the past month.<BR><BR>The stock is trading below its moving averages across multiple time frames, including the 5-day, 20-day, 50-day, 100-day, and 200-day averages, indicating a bearish trend. Additionally, investor participation has decreased, with delivery volume dropping by -35.99% compared to the 5-day average, suggesting reduced interest from investors.<BR><BR>Despite some positive factors, such as being net-debt free and having impressive growth in net sales and operating profit, the stock's recent performance has been overshadowed by its consistent underperformance against benchmarks. Over the past year, while the company has seen a significant increase in profits by 472%, the stock itself has generated a return of -35.96%, indicating a disconnect between the company's financial health and its stock performance. This combination of factors contributes to the ongoing decline in the stock price of Prime Industries Ltd.

View full answer

When is the next results date for Prime Industries Ltd?

05-Aug-2026

The next results date for Prime Industries Ltd is 10 August 2026.

The next results date for Prime Industries Ltd is scheduled for 10 August 2026.

View full answer

Should I buy, sell or hold Prime Industries Ltd?

04-Aug-2026

What does Prime Industries do?

11-Jun-2026

Prime Industries Ltd is a micro-cap company in the edible oil industry, reporting net sales of 28 Cr and a net profit of 1 Cr for March 2026. It was incorporated in 1992 and has a market cap of INR 99 Cr, with a P/E ratio of 11.00.

Overview:<BR>Prime Industries Ltd operates in the edible oil industry and is categorized as a micro-cap company.<BR><BR>History:<BR>The company was incorporated in October 1992 and was formerly known as Prime Proteins Limited. It changed its name to Prime Industries Limited on February 24, 1995. The latest quarterly results reported net sales and profit for March 2026.<BR><BR>Financial Snapshot:<BR>Net Sales: 28 Cr (Quarterly Results - Mar 2026) <BR>Net Profit: 1 Cr (Quarterly Results - Mar 2026) <BR>Market Cap: INR 99 Cr (Micro Cap)<BR><BR>Key Metrics:<BR>P/E: 11.00 <BR>Industry P/E: 32 <BR>Dividend Yield: 0.00% <BR>Debt-Equity: -0.01 <BR>Return on Equity: 21.40% <BR>Price to Book: 2.51 <BR><BR>Contact Details:<BR>Address: Master Chambers, 19 Feroze Gandhi Market Ludhiana Punjab : 141001 <BR>Tel: 91-161-3911525 <BR>Email: prime_indust@yahoo.com <BR>Website: https://www.primeindustrieslimited.com

View full answer

How big is Prime Industries?

11-Jun-2026

As of 10th June, Prime Industries Ltd has a market capitalization of 99.00 Cr, with recent net sales of 90.54 Cr and a net profit of 8.42 Cr. Shareholder's funds are 38.02 Cr and total assets are valued at 58.47 Cr as of March 2025.

As of 10th June, Prime Industries Ltd has a market capitalization of 99.00 Cr, categorizing it as a Micro Cap company.<BR><BR>In the latest four quarters, Prime Industries reported Net Sales of 90.54 Cr and a Net Profit of 8.42 Cr.<BR><BR>The latest annual period for the balance sheet is March 2025, where Shareholder's Funds amounted to 38.02 Cr and Total Assets were valued at 58.47 Cr.

View full answer

Who are in the management team of Prime Industries?

11-Jun-2026

The management team of Prime Industries includes R K Singhania (Managing Director), H S Arora (Director), and several independent directors: Ashwani Kumar, Rajiv Kalra, Anil Kumar Bhatia, Deepak Chauhan, and Ritu Sarin, along with Sandhya Gopi (Company Secretary) and Saket Agarwal (Non-Executive Director). This diverse team provides strong leadership and oversight for the company.

The management team of Prime Industries includes the following individuals:<BR><BR>1. R K Singhania - Managing Director<BR>2. H S Arora - Director<BR>3. Ashwani Kumar - Independent Director<BR>4. Rajiv Kalra - Independent Director<BR>5. Anil Kumar Bhatia - Independent Director<BR>6. Sandhya Gopi - Company Secretary & Compliance Officer<BR>7. Saket Agarwal - Non-Executive Director<BR>8. Deepak Chauhan - Independent Director<BR>9. Ritu Sarin - Independent Director<BR><BR>This team brings a mix of leadership and independent oversight to the company.

View full answer

Who are the peers of the Prime Industries?

11-Jun-2026

Peers of Prime Industries include Vijay Solvex, Ajanta Soya, M K Proteins, Sarda Proteins, Raj Oil Mills, Diligent Industries, and Rajgor Castor. Prime Industries has excellent growth and capital structure, with a 1-year return of -35.71%, better than Ajanta Soya's -47.07% but worse than Suraj Industries' 73.56%.

Peers: The peers of Prime Industries are Vijay Solvex, Ajanta Soya, M K Proteins, Sarda Proteins, Raj Oil Mills, Diligent Indust., and Rajgor Castor.<BR><BR>Quality Snapshot: Excellent management risk is observed at Rajgor Castor, while Below Average management risk is found at Vijay Solvex, Sarda Proteins, Diligent Indust., and Prime Industries, and Average management risk is noted at Ajanta Soya and M K Proteins. Growth is Excellent at Prime Industries and Rajgor Castor, while Below Average growth is seen at Vijay Solvex, Ajanta Soya, M K Proteins, Sarda Proteins, and the rest. Capital Structure is Excellent at Vijay Solvex, Ajanta Soya, M K Proteins, and Prime Industries, Good at Sarda Proteins, and Below Average at Diligent Indust.<BR><BR>Return Snapshot: The peer with the highest 1-year return is Suraj Industries at 73.56%, while Ajanta Soya has the lowest at -47.07%, and Prime Industries' 1-year return of -35.71% is better than Ajanta Soya's but worse than Suraj Industries'. Additionally, the six-month return is negative for Vijay Solvex, M K Proteins, Diligent Indust., and Raj Oil Mills.

View full answer

Are Prime Industries Ltd latest results good or bad?

30-May-2026

The latest results for Prime Industries Ltd are concerning, showing a 5.26% revenue growth but a sharp 57.14% decline in net profit and a significant drop in operating margins. This indicates operational challenges and raises doubts about the company's future sustainability, making the overall performance appear bad.

The latest results for Prime Industries Ltd indicate a challenging situation for the company. While there was a modest sequential revenue growth of 5.26%, increasing from ₹26.24 crores to ₹27.62 crores, this improvement was overshadowed by a significant decline in profitability. The net profit fell sharply by 57.14% quarter-on-quarter, dropping to ₹1.44 crores, and the operating margin decreased dramatically from 24.12% to 12.13%. <BR><BR>This combination of rising costs and declining margins suggests that the company is facing operational challenges that are impacting its ability to sustain profitability. Additionally, the stock has underperformed significantly over the past year, declining by 32.30%, which raises concerns about investor confidence and the company's future prospects.<BR><BR>Overall, the financial performance reflects a troubling inconsistency, with significant volatility in results that raises questions about the sustainability of the business model. Therefore, the latest results can be characterized as bad, highlighting critical operational issues that need to be addressed.

View full answer

How has been the historical performance of Prime Industries?

13-Nov-2025

Prime Industries reported no net sales in the fiscal year ending March 2025, but achieved a profit after tax of 1.47 due to other income. However, concerns about operational viability arise from negative cash flow and the absence of revenue generation.

Answer:<BR>The historical performance of Prime Industries shows a mixed picture, with significant changes in various financial metrics over the years.<BR><BR>Breakdown:<BR>In the fiscal year ending March 2025, Prime Industries reported net sales and total operating income of 0.00, indicating no revenue generation. The total expenditure, excluding depreciation, was 0.44, leading to an operating profit (PBDIT) of -0.44 before accounting for other income. However, the company recorded other income of 3.41, resulting in an operating profit of 2.97. After accounting for interest expenses of 1.02 and depreciation of 0.02, the profit before tax stood at 1.93, with a profit after tax of 1.47. The earnings per share (EPS) for the period was 0.7, while the diluted EPS was 0.87. The company’s total assets increased to 58.47 from 51.75 in the previous year, with total liabilities also rising to 58.47. Cash flow from operating activities was negative at -18.00, although cash and cash equivalents at the end of the period were 29.00, up from 26.00 the previous year. Overall, while Prime Industries has shown some profitability in terms of net profit, the lack of sales revenue and negative cash flow from operations raises concerns about its operational viability.

View full answer

How has been the historical performance of Prime Industries?

12-Nov-2025

Prime Industries has experienced a significant decline in net sales and profitability, with sales dropping from 12.83 Cr in Mar'20 to 0.00 Cr in Mar'25, while total assets increased from 8.00 Cr to 58.47 Cr, indicating a troubling trend of declining operational performance despite growing financial burdens.

Answer:<BR>The historical performance of Prime Industries shows significant fluctuations in its financial metrics over the years, particularly in net sales and profitability.<BR><BR>Breakdown:<BR>Prime Industries experienced a decline in net sales from 12.83 Cr in Mar'20 to 0.00 Cr in Mar'25, indicating a complete cessation of sales activity. The total operating income followed a similar trend, dropping from 12.83 Cr in Mar'20 to 0.00 Cr in Mar'25. Operating profit (PBDIT) also reflected this downturn, moving from a profit of 0.75 Cr in Mar'20 to a loss of 1.46 Cr in Mar'25. Profit before tax and profit after tax showed a similar pattern, with profit before tax decreasing from 0.75 Cr in Mar'20 to 1.93 Cr in Mar'25, while profit after tax fell from 0.75 Cr in Mar'20 to 1.47 Cr in Mar'25. The company's total assets increased from 8.00 Cr in Mar'20 to 58.47 Cr in Mar'25, primarily due to a rise in cash and bank balances, which grew from 1.66 Cr in Mar'20 to 29.82 Cr in Mar'25. However, total liabilities also increased from 8.00 Cr in Mar'20 to 58.47 Cr in Mar'25, indicating a growing financial burden. Overall, the data reveals a troubling trend of declining operational performance despite an increase in total assets and cash reserves.

View full answer

Who are the top shareholders of the Prime Industries?

17-Jul-2025

The top shareholders of Prime Industries are Race Eco Chain Limited with 20.71%, and promoter Rajinder Kumar Singhania with 11.19%. Individual investors hold a total of 36.67%, with no mutual funds or foreign institutional investors involved, and no pledged promoter holdings.

The top shareholders of Prime Industries include Race Eco Chain Limited, which holds the largest public share at 20.71%. The promoter with the highest individual holding is Rajinder Kumar Singhania, who owns 11.19%. Additionally, individual investors collectively hold 36.67% of the shares. There are no mutual funds or foreign institutional investors currently holding shares in the company, and there are no pledged promoter holdings.

View full answer

Is Prime Industries overvalued or undervalued?

09-Jun-2025

As of May 28, 2025, Prime Industries is considered risky and overvalued due to a high PE ratio of 100.69, negative EV metrics, a low ROE of 4.67%, and a significant year-to-date stock decline of 58.38%, contrasting with the Sensex's gain of 5.61%.

As of 28 May 2025, the valuation grade for Prime Industries has moved from very expensive to risky, indicating a significant shift in its perceived value. The company is currently overvalued based on its high PE ratio of 100.69 and a negative EV to EBIT and EV to EBITDA of -165.55, which suggest that the market is pricing the stock excessively compared to its earnings potential. Additionally, the ROE stands at a mere 4.67%, further highlighting the inefficiency in generating returns for shareholders.<BR><BR>When compared to peers in the Edible Oil industry, Prime Industries' valuation metrics appear unfavorable. For instance, while Prime has a PE ratio of 100.69, other companies in the sector may offer more attractive valuations. The company's recent stock performance has been dismal, with a year-to-date decline of 58.38%, contrasting sharply with the Sensex's gain of 5.61% in the same period. This underperformance reinforces the notion that Prime Industries is currently overvalued.

View full answer

What is the technical trend for Prime Industries?

09-Jun-2025

As of June 5, 2025, Prime Industries exhibits a mildly bearish technical trend, influenced by bearish daily moving averages and mixed signals from MACD and Bollinger Bands.

As of 5 June 2025, the technical trend for Prime Industries has changed from bearish to mildly bearish. The weekly MACD indicates a mildly bullish stance, while the monthly MACD remains bearish. The Bollinger Bands are showing a mildly bearish trend on both weekly and monthly time frames. Daily moving averages are bearish, suggesting short-term weakness. The KST is mildly bullish weekly but bearish monthly, and Dow Theory reflects a mildly bearish outlook weekly, contrasting with a mildly bullish stance monthly. Overall, the current technical stance is mildly bearish, driven primarily by the bearish daily moving averages and the mixed signals from MACD and Bollinger Bands.

View full answer

Has Prime Industries declared dividend?

06-Jun-2025

No Dividend History Available

iScoreScore
Click here to find our call on this stock
Strong Sell
Sell
Hold
Buy
Strong Buy

Dashboard

1

Consistent Underperformance against the benchmark over the last 3 years

  • Along with generating -35.96% returns in the last 1 year, the stock has also underperformed BSE500 in each of the last 3 annual periods
stock-summaryMojo Parameters

Mojo Parameters

Loading Valuation Snapshot...

Stock DNA

stock-summary
Industry

Edible Oil

stock-summary
Market cap

INR 84 Cr (Micro Cap)

stock-summary
P/E

10.00

stock-summary
Industry P/E

32

stock-summary
Dividend Yield

0.00%

stock-summary
Debt Equity

-0.01

stock-summary
Return on Equity

21.40%

stock-summary
Price to Book

2.13

Revenue and Profits:
Net Sales:
28 Cr
(Quarterly Results - Mar 2026)
Net Profit:
1 Cr
stock-summaryTotal Returns
Total Returns (Price + Dividend) stock-summary
Dividend Yield (0%)
TimePeriod
Price Return
Dividend Return
Total Return
3 Months
-18.39%
0%
-18.39%
6 Months
-5.29%
0%
-5.29%
1 Year
-35.96%
0%
-35.96%
2 Years
-78.58%
0%
-78.58%
3 Years
-72.14%
0%
-72.14%
4 Years
637.5%
0%
637.5%
5 Years
359.28%
0%
359.28%

Prime Industries for the last several years.

Risk Adjusted Returns v/s stock-summary
Returns Beta
Icon
Beta has not been calculated since enough price history is not available
stock-summaryNews & Corporate Actions

Announcements stock-summary

Board Meeting Intimation for Board Meeting To Be Held On 10Th Day Of August 2026.

04-Aug-2026 | Source : BSE

Prime Industries Ltdhas informed BSE that the meeting of the Board of Directors of the Company is scheduled on 10/08/2026 inter alia to consider and approve Standalone and Consolidated Un-audited Financial Results of the Company for the quarter ended 30th June 2026 along with Limited Review Report.

Compliances-Certificate under Reg. 74 (5) of SEBI (DP) Regulations 2018

03-Jul-2026 | Source : BSE

Certificate under Regulation 74(5) of SEBI (Depositories and Participants) Regulation 2018 for the Quarter ended 30th June 2026.

Compliances-Certificate under Reg. 74 (5) of SEBI (DP) Regulations 2018

03-Jul-2026 | Source : BSE

Certificate under Regulation 74(5) of SEBI (Depositories and Participants) Regulation 2018 for the quarter ended 30th June 2026.

Corporate Actions stock-summary

stock-summary
BOARD MEETING

10 Aug 2026

stock-summary
DIVIDEND

No Dividend history available

stock-summary
SPLITS

Prime Industries Ltd has announced 5:10 stock split, ex-date: 12 Sep 19

stock-summary
BONUS

No Bonus history available

stock-summary
RIGHTS

No Rights history available

stock-summaryKey Factors

Quality key factors stock-summary

Factor
Value
Sales Growth (5y)
9,059.00%
EBIT Growth (5y)
1,584.00%
EBIT to Interest (avg)
5.27
Debt to EBITDA (avg)
Negative Net Debt
Net Debt to Equity (avg)
-0.01
Sales to Capital Employed (avg)
1.16
Tax Ratio
2.56%
Dividend Payout Ratio
0
Pledged Shares
0
Institutional Holding
0.97%
ROCE (avg)
12.38%
ROE (avg)
12.63%

Valuation key factors

Factor
Value
P/E Ratio
10
Industry P/E
32
Price to Book Value
2.04
EV to EBIT
5.17
EV to EBITDA
4.98
EV to Capital Employed
2.05
EV to Sales
0.88
PEG Ratio
0.03
Dividend Yield
NA
ROCE (Latest)
39.70%
ROE (Latest)
21.40%

Technicals key factors

Indicator
Weekly
Monthly
MACD
Bearish
Mildly Bullish
RSI
No Signal
No Signal
Bollinger Bands
Bearish
Bearish
Moving Averages
Mildly Bullish (Daily)
KST
Mildly Bearish
Bearish
Dow Theory
Mildly Bearish
Mildly Bearish
stock-summary Technical Indicator Scale: Bearish, Mildly Bearish, Sideways, Mildly Bullish, Bullish  Turned 
stock-summaryShareholding
Shareholding Snapshot : Jun 2026stock-summary
Shareholding Compare (%holding) stock-summary
Majority shareholders

Non Institution

Pledged Promoter Holdings

None

Mutual Funds

Held by 0 Schemes

FIIs

Held by 0 FIIs

Promoter with highest holding

Rajinder Kumar Singhania (6.24%)

Highest Public shareholder

Race Eco Chain Limited (20.71%)

Individual Investors Holdings

35.15%

stock-summaryFinancial
[
  {
    "link": "quarterly",
    "btn_text": "All Quarterly Results",
    "header": "Quarterly Results Snapshot (Standalone) - Mar'26 - QoQ",
    "rhs": [
      {
        "prefix": "Net Sales ",
        "suffix": "QoQ Growth in quarter ended Mar 2026 is -58.22% vs -52.83% in Dec 2025",
        "dir": -1
      },
      {
        "prefix": "Standalone Net Profit ",
        "suffix": "QoQ Growth in quarter ended Mar 2026 is -13.16% vs 26.67% in Dec 2025",
        "dir": -1
      }
    ],
    "table": {
      "header": [
        "Mar'26",
        "Dec'25",
        "Change(%)"
      ],
      "body": [
        {
          "field": "Net Sales",
          "val1": "0.94",
          "val2": "2.25",
          "chgp": "-58.22%",
          "chgp_class": "negative"
        },
        {
          "field": "Operating Profit (PBDIT) excl Other Income",
          "val1": "0.04",
          "val2": "-0.06",
          "chgp": "166.67%",
          "chgp_class": "positive"
        },
        {
          "field": "Interest",
          "val1": "0.44",
          "val2": "0.02",
          "chgp": "2,100.00%",
          "chgp_class": "negative"
        },
        {
          "field": "Exceptional Items",
          "val1": "0.00",
          "val2": "0.00",
          "chgp": "",
          "chgp_class": "neutral"
        },
        {
          "field": "Standalone Net Profit",
          "val1": "0.33",
          "val2": "0.38",
          "chgp": "-13.16%",
          "chgp_class": "negative"
        },
        {
          "field": "Operating Profit Margin (Excl OI)",
          "val1": "4.26%",
          "val2": "-2.67%",
          "chgp": "6.93%",
          "chgp_class": "positive"
        }
      ]
    }
  },
  {
    "link": "half-yearly",
    "btn_text": "All Half Yearly Results",
    "header": "Half Yearly Results Snapshot (Standalone) - Sep'25",
    "rhs": [
      {
        "prefix": "Net Sales ",
        "suffix": " Growth in half year ended Sep 2025 is 0.00% vs -100.00% in Sep 2024",
        "dir": 1
      },
      {
        "prefix": "Standalone Net Profit ",
        "suffix": " Growth in half year ended Sep 2025 is 61.11% vs -96.59% in Sep 2024",
        "dir": 1
      }
    ],
    "table": {
      "header": [
        "Sep'25",
        "Sep'24",
        "Change(%)"
      ],
      "body": [
        {
          "field": "Net Sales",
          "val1": "4.77",
          "val2": "0.00",
          "chgp": "",
          "chgp_class": "neutral"
        },
        {
          "field": "Operating Profit (PBDIT) excl Other Income",
          "val1": "-0.68",
          "val2": "-0.95",
          "chgp": "28.42%",
          "chgp_class": "positive"
        },
        {
          "field": "Interest",
          "val1": "0.47",
          "val2": "0.67",
          "chgp": "-29.85%",
          "chgp_class": "positive"
        },
        {
          "field": "Exceptional Items",
          "val1": "0.00",
          "val2": "0.00",
          "chgp": "",
          "chgp_class": "neutral"
        },
        {
          "field": "Standalone Net Profit",
          "val1": "0.58",
          "val2": "0.36",
          "chgp": "61.11%",
          "chgp_class": "positive"
        },
        {
          "field": "Operating Profit Margin (Excl OI)",
          "val1": "-14.26%",
          "val2": "0.00%",
          "chgp": "-14.26%",
          "chgp_class": "negative"
        }
      ]
    }
  },
  {
    "link": "nine-monthly",
    "btn_text": "All Nine Monthly Results",
    "header": "Nine Monthly Results Snapshot (Standalone) - Dec'25",
    "rhs": [
      {
        "prefix": "Net Sales ",
        "suffix": "YoY Growth in nine months ended Dec 2025 is 0.00% vs -100.00% in Dec 2024",
        "dir": 1
      },
      {
        "prefix": "Standalone Net Profit ",
        "suffix": "YoY Growth in nine months ended Dec 2025 is -18.64% vs -89.30% in Dec 2024",
        "dir": 1
      }
    ],
    "table": {
      "header": [
        "Dec'25",
        "Dec'24",
        "Change(%)"
      ],
      "body": [
        {
          "field": "Net Sales",
          "val1": "7.02",
          "val2": "0.00",
          "chgp": "",
          "chgp_class": "neutral"
        },
        {
          "field": "Operating Profit (PBDIT) excl Other Income",
          "val1": "-0.74",
          "val2": "-1.04",
          "chgp": "28.85%",
          "chgp_class": "positive"
        },
        {
          "field": "Interest",
          "val1": "0.49",
          "val2": "1.01",
          "chgp": "-51.49%",
          "chgp_class": "positive"
        },
        {
          "field": "Exceptional Items",
          "val1": "0.00",
          "val2": "0.00",
          "chgp": "",
          "chgp_class": "neutral"
        },
        {
          "field": "Standalone Net Profit",
          "val1": "0.96",
          "val2": "1.18",
          "chgp": "-18.64%",
          "chgp_class": "negative"
        },
        {
          "field": "Operating Profit Margin (Excl OI)",
          "val1": "-10.54%",
          "val2": "0.00%",
          "chgp": "-10.54%",
          "chgp_class": "negative"
        }
      ]
    }
  },
  {
    "link": "annual",
    "btn_text": "All Annual Results",
    "header": "Annual Results Snapshot (Standalone) - Mar'26",
    "rhs": [
      {
        "prefix": "Net Sales ",
        "suffix": "YoY Growth in year ended Mar 2026 is 0.00% vs -100.00% in Mar 2025",
        "dir": 1
      },
      {
        "prefix": "Standalone Net Profit ",
        "suffix": "YoY Growth in year ended Mar 2026 is -12.24% vs -86.44% in Mar 2025",
        "dir": 1
      }
    ],
    "table": {
      "header": [
        "Mar'26",
        "Mar'25",
        "Change(%)"
      ],
      "body": [
        {
          "field": "Net Sales",
          "val1": "7.95",
          "val2": "0.00",
          "chgp": "",
          "chgp_class": "neutral"
        },
        {
          "field": "Operating Profit (PBDIT) excl Other Income",
          "val1": "-1.16",
          "val2": "-1.46",
          "chgp": "20.55%",
          "chgp_class": "positive"
        },
        {
          "field": "Interest",
          "val1": "0.93",
          "val2": "1.02",
          "chgp": "-8.82%",
          "chgp_class": "positive"
        },
        {
          "field": "Exceptional Items",
          "val1": "0.00",
          "val2": "0.00",
          "chgp": "",
          "chgp_class": "neutral"
        },
        {
          "field": "Standalone Net Profit",
          "val1": "1.29",
          "val2": "1.47",
          "chgp": "-12.24%",
          "chgp_class": "negative"
        },
        {
          "field": "Operating Profit Margin (Excl OI)",
          "val1": "-14.59%",
          "val2": "0.00%",
          "chgp": "-14.59%",
          "chgp_class": "negative"
        }
      ]
    }
  }
]

Quarterly Results Snapshot (Standalone) - Mar'26 - QoQstock-summary

Mar'26
Dec'25
Change(%)
Net Sales
0.94
2.25
-58.22%
Operating Profit (PBDIT) excl Other Income
0.04
-0.06
166.67%
Interest
0.44
0.02
2,100.00%
Exceptional Items
0.00
0.00
Standalone Net Profit
0.33
0.38
-13.16%
Operating Profit Margin (Excl OI)
4.26%
-2.67%
6.93%
Values in Rs Cr.
Direction Arrows
Net Sales

QoQ Growth in quarter ended Mar 2026 is -58.22% vs -52.83% in Dec 2025

Direction Arrows
Standalone Net Profit

QoQ Growth in quarter ended Mar 2026 is -13.16% vs 26.67% in Dec 2025

Half Yearly Results Snapshot (Standalone) - Sep'25stock-summary

Sep'25
Sep'24
Change(%)
Net Sales
4.77
0.00
Operating Profit (PBDIT) excl Other Income
-0.68
-0.95
28.42%
Interest
0.47
0.67
-29.85%
Exceptional Items
0.00
0.00
Standalone Net Profit
0.58
0.36
61.11%
Operating Profit Margin (Excl OI)
-14.26%
0.00%
-14.26%
Values in Rs Cr.
Direction Arrows
Net Sales

Growth in half year ended Sep 2025 is 0.00% vs -100.00% in Sep 2024

Direction Arrows
Standalone Net Profit

Growth in half year ended Sep 2025 is 61.11% vs -96.59% in Sep 2024

Nine Monthly Results Snapshot (Standalone) - Dec'25stock-summary

Dec'25
Dec'24
Change(%)
Net Sales
7.02
0.00
Operating Profit (PBDIT) excl Other Income
-0.74
-1.04
28.85%
Interest
0.49
1.01
-51.49%
Exceptional Items
0.00
0.00
Standalone Net Profit
0.96
1.18
-18.64%
Operating Profit Margin (Excl OI)
-10.54%
0.00%
-10.54%
Values in Rs Cr.
Direction Arrows
Net Sales

YoY Growth in nine months ended Dec 2025 is 0.00% vs -100.00% in Dec 2024

Direction Arrows
Standalone Net Profit

YoY Growth in nine months ended Dec 2025 is -18.64% vs -89.30% in Dec 2024

Annual Results Snapshot (Standalone) - Mar'26stock-summary

Mar'26
Mar'25
Change(%)
Net Sales
7.95
0.00
Operating Profit (PBDIT) excl Other Income
-1.16
-1.46
20.55%
Interest
0.93
1.02
-8.82%
Exceptional Items
0.00
0.00
Standalone Net Profit
1.29
1.47
-12.24%
Operating Profit Margin (Excl OI)
-14.59%
0.00%
-14.59%
Values in Rs Cr.
Direction Arrows
Net Sales

YoY Growth in year ended Mar 2026 is 0.00% vs -100.00% in Mar 2025

Direction Arrows
Standalone Net Profit

YoY Growth in year ended Mar 2026 is -12.24% vs -86.44% in Mar 2025

stock-summaryCompany CV
About Prime Industries Ltd stock-summary
stock-summary
Prime Industries Ltd
Micro Cap
Edible Oil
Prime Industries Limited, formerly known as Prime Proteins Limited was incorporated in October, 1992 promoted by R K Singhania, M L Goyal and Harjeet Singh Aurora. The Company retained its present name 'Prime Industries Limited' on February 24, 1995. The Company came with an IPO in the year 1993 of Rs. 2,90,00,000. It set up a plant in Ferozepur in the State of Punjab to part-finance the project for manufacture of Vanaspati Ghee.
Company Coordinates stock-summary
Company Details
Master Chambers, 19 Feroze Gandhi Market Ludhiana Punjab : 141001
stock-summary
Tel: 91-161-3911525
stock-summary
prime_indust@yahoo.com
Registrar Details
Skyline Financial Services Pvt Ltd , D-153/A, 1st Floor, Okhla Industrial Area, Phase - I, New Delhi