Prime Urban

  • Market Cap: Micro Cap
  • Industry: Realty
  • ISIN: INE419E01024
  • NSEID:
  • BSEID: 521149
INR
10.81
0.86 (8.64%)
BSENSE

Dec 05

BSE+NSE Vol: 13

  • Price Points
  • Score
  • Mojo Parameters
  • Total Return
  • News and Corporate Actions
  • Key factors
  • Shareholding
  • Financials
  • CompanyCV
stock-summaryPrice Point
High/Low

1Day

52 Week

Valuation
Technical
Day's Volume

CASH

13 (3,150.00%) Volume

Shareholding (Sep 2025)

FII

0.00%

Held by 0 FIIs

DII

0.00%

Held by 0 DIIs

Promoter

72.08%

how big is Prime Urban?

06-Jun-2025

As of Jun 06, Prime Urban Development India Ltd has a market capitalization of 26.51 Cr, classifying it as a Micro Cap company, with recent net sales of 3.59 Cr and a net profit of 1.25 Cr over the last four quarters.

Market Cap: As of Jun 06, Prime Urban Development India Ltd has a market capitalization of 26.51 Cr, categorizing it as a Micro Cap company.<BR><BR>Recent Quarterly Performance: The sum of Net Sales for the latest 4 quarters, which includes data from Mar'25, Dec'24, Sep'24, and Jun'24, is 3.59 Cr. The sum of Net Profit for the same period is 1.25 Cr. This data is presented on a Consolidated basis.<BR><BR>Balance Sheet Snapshot: This is Consolidated data for the latest annual period ending Mar'24. Shareholder's Funds are reported at -3.77 Cr, while Total Assets amount to 19.37 Cr.

Read More

What does Prime Urban do?

06-Jun-2025

Prime Urban Development India Ltd is a micro-cap realty development company, formerly known as Asher Textiles Limited, with a market cap of Rs 25 Cr and reported net sales of 3 Cr and net profit of 2 Cr for March 2025. The company has a P/E ratio of 20.00 and a return on equity of 42.22%.

Overview:<BR>Prime Urban Development India Ltd is engaged in realty development and operates within the micro-cap market segment.<BR><BR>History:<BR>The company was initially incorporated in 1936 under the name 'Asher Textiles Limited' and underwent several name changes, becoming Prime Urban Development India Limited on July 5, 2010. The latest quarterly results reported net sales and net profit for March 2025.<BR><BR>Financial Snapshot:<BR>- Net Sales: 3 Cr (Quarterly Results - Mar 2025)<BR>- Net Profit: 2 Cr (Quarterly Results - Mar 2025)<BR>- Market-cap: Rs 25 Cr (Micro Cap)<BR><BR>Key Metrics:<BR>- P/E: 20.00<BR>- Industry P/E: 30<BR>- Dividend Yield: 0.00%<BR>- Debt Equity: -1.58<BR>- Return on Equity: 42.22%<BR>- Price to Book: -5.40<BR><BR>Contact Details:<BR>Address: 110 Avinashi Road, PB No 154 Gandhinagar P O Tirupur Tamil Nadu : 641603<BR>Tel: 91-0422-4307800<BR>Email: companysecretary@ptlonline.com<BR>Website: http://www.ptlonline.com

Read More

Who are in the management team of Prime Urban?

06-Jun-2025

As of March 2022, the management team of Prime Urban includes Purushottam Patodia (Chairman & Managing Director), Manojjkumar Patodia, Anujj K Patodia (Directors), N K Bafna, Shailly Kedia (Independent Directors), and Darshi Shah (Company Secretary & Compliance Officer). Each member contributes to the company's governance and operations.

As of March 2022, the management team of Prime Urban consists of the following individuals:<BR><BR>1. Purushottam Patodia - Chairman & Managing Director<BR>2. Manojjkumar Patodia - Director<BR>3. Anujj K Patodia - Director<BR>4. N K Bafna - Independent Director<BR>5. Darshi Shah - Company Secretary & Compliance Officer<BR>6. Shailly Kedia - Independent Director<BR><BR>Each member plays a significant role in the governance and operational management of the company.

Read More

Has Prime Urban declared dividend?

06-Jun-2025

Yes, Prime Urban Development India Ltd has declared a 20% dividend (₹0.4 per share) with an ex-date of August 3, 2017. Despite the dividend declaration, the yield is 0%, and total returns have varied, showing significant gains over the long term but declines in shorter periods.

Yes, Prime Urban Development India Ltd has declared a dividend.<BR><BR>Dividend Details:<BR>- Percentage announced: 20%<BR>- Amount per share: 0.4<BR>- Ex-date: 03 Aug 17<BR><BR>Dividend Yield: 0%<BR><BR>Total Returns by Period:<BR>Over the 6-month period, the price return was -16.36%, the dividend return was 0%, resulting in a total return of -16.36%.<BR><BR>In the 1-year period, the price return was -4.21%, the dividend return was 0%, leading to a total return of -4.21%.<BR><BR>For the 2-year period, the price return was 25.79%, the dividend return was 0%, which resulted in a total return of 25.79%.<BR><BR>During the 3-year period, the price return was -12.13%, the dividend return was 0%, giving a total return of -12.13%.<BR><BR>In the 4-year period, the price return was 17.3%, the dividend return was 0%, culminating in a total return of 17.3%.<BR><BR>Over the 5-year period, the price return was 91.58%, the dividend return was 0%, resulting in a total return of 91.58%.<BR><BR>Overall, while Prime Urban Development India Ltd has declared a dividend, the dividend yield remains at 0%. The total returns show a mixed performance over different periods, with significant gains over the longer term despite recent declines in shorter periods.

Read More

Who are the peers of the Prime Urban?

03-Jun-2025

Prime Urban's peers include DLF, Macrotech Development, Godrej Properties, Prestige Estates, Oberoi Realty, Kamanwala Housing, IITL Projects, Steel Strips Infrastructure, and SVS Ventures. SVS Ventures has the highest 1-year return at 45.41%, while Godrej Properties has the lowest at -21.74%, with Prime Urban's return at -0.10%.

Peers: The peers of Prime Urban are DLF, Macrotech Devel., Godrej Propert., Prestige Estates, Oberoi Realty, Kamanwala Housin, IITL Projects, Steel Strips Inf, SVS Ventures.<BR><BR>Quality Snapshot: Excellent management risk is observed at Macrotech Devel. and Oberoi Realty, while Average management risk is found at DLF, Godrej Propert., Prestige Estates, and Steel Strips Inf. Below Average management risk is noted for Kamanwala Housin and SVS Ventures, and the rest do not qualify. Growth is Excellent at Macrotech Devel. and Oberoi Realty, Average at DLF, and Below Average at Godrej Propert., Prestige Estates, Kamanwala Housin, Steel Strips Inf, and SVS Ventures, with the rest not qualifying. Capital Structure is Good at DLF and SVS Ventures, Excellent at Oberoi Realty, and Below Average at Macrotech Devel., Godrej Propert., Prestige Estates, Kamanwala Housin, and Steel Strips Inf, with the rest not qualifying.<BR><BR>Return Snapshot: The peer with the highest 1-year return is SVS Ventures at 45.41%, while the lowest is Godrej Propert. at -21.74%. Prime Urban's own 1-year return is -0.10%, which is higher than Godrej Propert. but lower than SVS Ventures. Additionally, Kamanwala Housin is the only peer with a positive six-month return, while the rest have negative returns.

Read More

Is Prime Urban overvalued or undervalued?

09-Jun-2025

As of July 26, 2023, Prime Urban's valuation grade has shifted to risky due to concerning financial metrics, including a PE ratio of 21.21 and a negative ROCE of -60.95%, indicating it is overvalued compared to peers like PTC India, and its stock has underperformed the Sensex by 20.89% year-to-date.

As of 26 July 2023, the valuation grade for Prime Urban has moved from does not qualify to risky, indicating a more cautious outlook on the company's financial health. The company appears to be overvalued based on its current metrics, with a PE ratio of 21.21, an EV to EBIT of -33.94, and a PEG ratio of 0.13. These ratios suggest that despite the company's valuation grade, its financial performance is concerning, particularly with a negative return on capital employed (ROCE) of -60.95%.<BR><BR>In comparison to its peers, Prime Urban's valuation metrics stand out unfavorably. For instance, MMTC has a PE ratio of 119.39, while PTC India, which is categorized as very attractive, has a significantly lower PE of 9.02. This stark contrast highlights that Prime Urban's valuation does not align with its financial performance and market position. Additionally, the company's stock has underperformed relative to the Sensex, particularly year-to-date, where it has declined by 20.89% compared to the Sensex's gain of 5.62%.

Read More

What is the technical trend for Prime Urban?

09-Jun-2025

As of April 30, 2025, Prime Urban's technical trend is mildly bearish, influenced by daily moving averages and mixed signals from MACD and KST, despite some mildly bullish indicators from Dow Theory.

As of 30 April 2025, the technical trend for Prime Urban has changed from bearish to mildly bearish. The weekly MACD is mildly bullish, while the monthly MACD is mildly bearish, indicating mixed signals. The moving averages on the daily timeframe are mildly bearish, which contributes to the overall bearish sentiment. The KST shows a mildly bullish stance on the weekly but is mildly bearish on the monthly, further complicating the outlook. The Dow Theory supports a mildly bullish view on both weekly and monthly timeframes, but the OBV indicates a mildly bearish trend. Overall, the current technical stance is mildly bearish, driven primarily by the daily moving averages and the mixed signals from MACD and KST.

Read More

Who are the top shareholders of the Prime Urban?

17-Jul-2025

The top shareholder of Prime Urban is Pat Credit Limited, owning 22.56% of the shares. Gnanadev Polisetty is the largest individual shareholder at 4.04%, while individual investors hold a total of 20.18%, and there are no foreign institutional investors involved.

The top shareholders of Prime Urban include Pat Credit Limited, which holds the largest share at 22.56%. The majority of the company's shares are held by promoters, with no pledged promoter holdings reported. In terms of public shareholders, Gnanadev Polisetty is the highest individual shareholder, owning 4.04%. Additionally, individual investors collectively hold 20.18% of the shares, while mutual funds have a minimal presence, held by just two schemes at 0.01%. There are currently no foreign institutional investors (FIIs) holding shares in the company.

Read More

When is the next results date for Prime Urban?

08-Aug-2025

The next results date for Prime Urban is 14 August 2025.

The next results date for Prime Urban is scheduled for 14 August 2025.

Read More

Are Prime Urban latest results good or bad?

14-Aug-2025

Prime Urban Development India's latest results show a significant improvement in profitability with a PAT of Rs 2.03 crore, up 315.96% year on year, despite a concerning 100% decline in net sales. Overall, while profitability is strong, the drop in sales and a 'Sell' rating indicate ongoing market challenges.

Prime Urban Development India's latest results indicate a significant turnaround in their financial performance, particularly in terms of profitability. The company reported a Profit After Tax (PAT) of Rs 2.03 crore for the first half of the year, which marks an impressive growth of 315.96% year on year. This is a notable improvement compared to the previous year's loss of Rs -1.46 crore, suggesting that the company has effectively surpassed its earnings from the prior year within just six months.<BR><BR>However, it's important to note that while the PAT shows positive growth, the company's net sales have experienced a drastic decline of 100% year on year, which raises concerns about revenue generation. Additionally, despite the improvement in profitability, the company's overall score has decreased from 17 to 11 over the last three months, and it is currently rated as a 'Sell' by MarketsMOJO. <BR><BR>In summary, while the profitability metrics are strong and indicate a positive trend, the challenges in sales and the rating suggest that the company is still facing hurdles in the market.

Read More

How has been the historical performance of Prime Urban?

15-Nov-2025

Prime Urban has experienced a significant decline in net sales and profitability, with net sales dropping from 151.90 crore in March 2019 to 3.59 crore in March 2025. However, it has shown signs of recovery, achieving a net profit of 1.25 crore in March 2025 and improving its operating profit margin.

Answer:<BR>The historical performance of Prime Urban shows a significant decline in net sales and profitability over the years, culminating in a net profit of 1.25 crore in March 2025, a recovery from losses in the previous years.<BR><BR>Breakdown:<BR>Prime Urban's net sales have drastically decreased from 151.90 crore in March 2019 to just 3.59 crore in March 2025. This decline is mirrored in total operating income, which fell from 52.37 crore in March 2020 to the same 3.59 crore in March 2025. The company has faced increasing operational challenges, reflected in its total expenditure, which has also decreased from 152.35 crore in March 2019 to 3.67 crore in March 2025. Despite these challenges, the operating profit margin has shown improvement, moving from -13.53% in March 2022 to -2.23% in March 2025, indicating a narrowing of losses. The profit before tax turned positive at 1.69 crore in March 2025, a notable turnaround from the losses recorded in prior years. The company's total liabilities have decreased from 42.50 crore in March 2020 to 13.25 crore in March 2025, while total assets have similarly declined from 42.50 crore to 13.25 crore in the same period. Cash flow from operating activities has improved to 2.00 crore in March 2025, up from a negative cash flow in earlier years, suggesting a potential stabilization in operations. Overall, while Prime Urban has faced significant challenges, recent data indicates a potential recovery in profitability and operational efficiency.

Read More

Should I buy, sell or hold Prime Urban?

16-Nov-2025

Why is Prime Urban falling/rising?

04-Dec-2025

As of 04-Dec, Prime Urban Development India Ltd's stock price is at 9.95, reflecting a 4.19% increase. While it has shown short-term gains, its year-to-date performance is negative at -21.28%, and declining investor participation raises concerns about future interest.

As of 04-Dec, Prime Urban Development India Ltd's stock price is rising, currently at 9.95, reflecting a change of 0.4 or 4.19% increase. This upward movement is supported by a strong performance over the last two days, during which the stock has gained 6.76%. Additionally, it has outperformed its sector by 4.17% today. <BR><BR>In the short term, the stock has shown a weekly increase of 4.74%, contrasting with a slight decline of 0.53% in the benchmark Sensex. However, it is important to note that the stock's year-to-date performance remains negative at -21.28%, while the Sensex has increased by 9.12% during the same period. <BR><BR>Despite the recent gains, there are signs of falling investor participation, as evidenced by a significant drop in delivery volume, which decreased by 55.26% compared to the 5-day average. This could indicate a potential concern regarding sustained interest in the stock moving forward. <BR><BR>Overall, the current rise in Prime Urban Development's stock price is primarily attributed to its recent performance and short-term gains, despite underlying challenges in investor participation and longer-term performance metrics.

Read More
iScoreScore
Click here to find our call on this stock
Strong Sell
Sell
Hold
Buy
Strong Buy

MarketsMojo — Loved in India, Now Global

The power of Mojo is now in 29 countries. Explore global equities with the same cutting-edge features you love.

Dashboard
1

With a Negative Book Value, the company has a Weak Long Term Fundamental Strength

  • Poor long term growth as Net Sales has grown by an annual rate of -23.91% and Operating profit at 0% over the last 5 years
  • High Debt Company with a Debt to Equity ratio (avg) at 0 times
2

Flat results in Sep 25

 
3

Risky - Negative Operating Profits

4

Below par performance in long term as well as near term

stock-summaryMojo Parameters
Mojo Parameters
Loading Valuation Snapshot...
Stock DNA
stock-summary
Industry

Realty

stock-summary
Market cap

INR 27 Cr (Micro Cap)

stock-summary
P/E

11.00

stock-summary
Industry P/E

52

stock-summary
Dividend Yield

0.00%

stock-summary
Debt Equity

-0.18

stock-summary
Return on Equity

-78.84%

stock-summary
Price to Book

-9.05

Revenue and Profits:
Net Sales:
(Quarterly Results - Sep 2025)
Net Profit:
0 Cr
stock-summaryTotal Returns
Total Returns (Price + Dividend) stock-summary
Dividend Yield (0%)
TimePeriod
Price Return
Dividend Return
Total Return
3 Months
-22.79%
0%
-22.79%
6 Months
13.67%
0%
13.67%
1 Year
-6.0%
0%
-6.0%
2 Years
27.18%
0%
27.18%
3 Years
48.08%
0%
48.08%
4 Years
24.11%
0%
24.11%
5 Years
59.68%
0%
59.68%

Latest dividend: 0.4 per share ex-dividend date: Aug-03-2017

Risk Adjusted Returns v/s stock-summary
Returns Beta
Icon
Beta has not been calculated since enough price history is not available
stock-summaryNews & Corporate Actions
News
Announcements stock-summary

Board Meeting Outcome for Board Meeting Outcome - 14.11.2025

14-Nov-2025 | Source : BSE

Board meeting outcome - 14.11.2025

Results - Financial Results For QE 30.09.2025

14-Nov-2025 | Source : BSE

Financial Results for QE 30.09.2025

Board Meeting Intimation for Au-Audited Financial Results For Quarter And Half Year Ended September 30 2025

07-Nov-2025 | Source : BSE

Prime Urban Development India Ltdhas informed BSE that the meeting of the Board of Directors of the Company is scheduled on 14/11/2025 inter alia to consider and approve un-audited financial results of the company for quarter and half year ended September 30 2025

Corporate Actions stock-summary
stock-summary
BOARD MEETING

No Upcoming Board Meetings

stock-summary
DIVIDEND

Prime Urban Development India Ltd has declared 20% dividend, ex-date: 03 Aug 17

stock-summary
SPLITS

Prime Urban Development India Ltd has announced 2:10 stock split, ex-date: 13 Mar 07

stock-summary
BONUS

No Bonus history available

stock-summary
RIGHTS

No Rights history available

stock-summaryKey Factors
Quality key factors stock-summary
Factor
Value
Sales Growth (5y)
-23.91%
EBIT Growth (5y)
14.25%
EBIT to Interest (avg)
0
Debt to EBITDA (avg)
Negative Net Debt
Net Debt to Equity (avg)
-0.18
Sales to Capital Employed (avg)
0
Tax Ratio
Tax Ratio is Negative%
Dividend Payout Ratio
0
Pledged Shares
0
Institutional Holding
0.01%
ROCE (avg)
-20.04%
ROE (avg)
0
Valuation key factors
Factor
Value
P/E Ratio
11
Industry P/E
52
Price to Book Value
-9.05
EV to EBIT
-27.03
EV to EBITDA
27.03
EV to Capital Employed
-11.22
EV to Sales
7.83
PEG Ratio
0.05
Dividend Yield
NA
ROCE (Latest)
Negative Capital Employed
ROE (Latest)
Negative BV
Technicals key factors
Indicator
Weekly
Monthly
MACD
Bearish
Mildly Bearish
RSI
No Signal
No Signal
Bollinger Bands
Mildly Bearish
Mildly Bearish
Moving Averages
Bearish (Daily)
KST
Bearish
Mildly Bearish
Dow Theory
No Trend
No Trend
OBV
Mildly Bullish
No Trend
stock-summary Technical Indicator Scale: Bearish, Mildly Bearish, Sideways, Mildly Bullish, Bullish  Turned 
stock-summaryShareholding
Shareholding Snapshot : Sep 2025stock-summary
Shareholding Compare (%holding) stock-summary
Majority shareholders

Promoters

Pledged Promoter Holdings

None

Mutual Funds

Held by 2 Schemes (0.01%)

FIIs

Held by 0 FIIs

Promoter with highest holding

Pat Credit Limited (22.56%)

Highest Public shareholder

Gnanadev Polisetty (4.03%)

Individual Investors Holdings

20.1%

stock-summaryFinancial
[
  {
    "link": "quarterly",
    "btn_text": "All Quarterly Results",
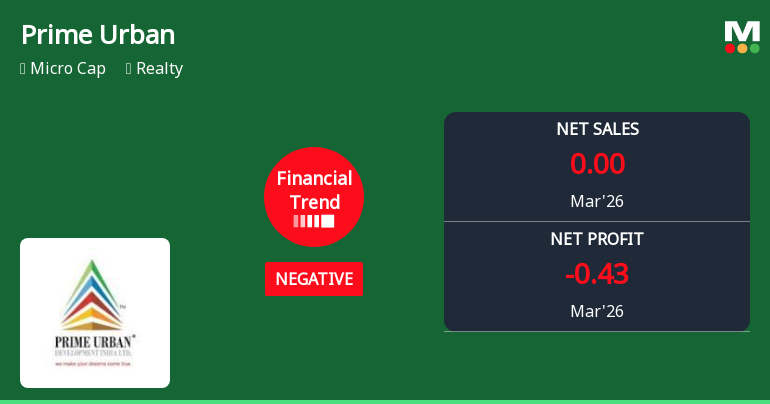
    "header": "Quarterly Results Snapshot (Consolidated) - Sep'25 - YoY",
    "rhs": [
      {
        "prefix": "Net Sales ",
        "suffix": "YoY Growth in quarter ended Sep 2025 is 0.00% vs -100.00% in Sep 2024",
        "dir": 1
      },
      {
        "prefix": "Consolidated Net Profit ",
        "suffix": "YoY Growth in quarter ended Sep 2025 is 170.21% vs -20.51% in Sep 2024",
        "dir": 1
      }
    ],
    "table": {
      "header": [
        "Sep'25",
        "Sep'24",
        "Change(%)"
      ],
      "body": [
        {
          "field": "Net Sales",
          "val1": "0.00",
          "val2": "0.00",
          "chgp": "",
          "chgp_class": "neutral"
        },
        {
          "field": "Operating Profit (PBDIT) excl Other Income",
          "val1": "-0.23",
          "val2": "-0.34",
          "chgp": "32.35%",
          "chgp_class": "positive"
        },
        {
          "field": "Interest",
          "val1": "0.03",
          "val2": "0.20",
          "chgp": "-85.00%",
          "chgp_class": "positive"
        },
        {
          "field": "Exceptional Items",
          "val1": "0.00",
          "val2": "0.00",
          "chgp": "",
          "chgp_class": "neutral"
        },
        {
          "field": "Consolidate Net Profit",
          "val1": "0.33",
          "val2": "-0.47",
          "chgp": "170.21%",
          "chgp_class": "positive"
        },
        {
          "field": "Operating Profit Margin (Excl OI)",
          "val1": "0.00%",
          "val2": "0.00%",
          "chgp": "NA",
          "chgp_class": "neutral"
        }
      ]
    }
  },
  {
    "link": "half-yearly",
    "btn_text": "All Half Yearly Results",
    "header": "Half Yearly Results Snapshot (Consolidated) - Sep'25",
    "rhs": [
      {
        "prefix": "Net Sales ",
        "suffix": " Growth in half year ended Sep 2025 is -100.00% vs -96.32% in Sep 2024",
        "dir": -1
      },
      {
        "prefix": "Consolidated Net Profit ",
        "suffix": " Growth in half year ended Sep 2025 is 115.22% vs 6.12% in Sep 2024",
        "dir": 1
      }
    ],
    "table": {
      "header": [
        "Sep'25",
        "Sep'24",
        "Change(%)"
      ],
      "body": [
        {
          "field": "Net Sales",
          "val1": "0.00",
          "val2": "0.14",
          "chgp": "-100.00%",
          "chgp_class": "negative"
        },
        {
          "field": "Operating Profit (PBDIT) excl Other Income",
          "val1": "-0.50",
          "val2": "-0.64",
          "chgp": "21.88%",
          "chgp_class": "positive"
        },
        {
          "field": "Interest",
          "val1": "0.06",
          "val2": "0.38",
          "chgp": "-84.21%",
          "chgp_class": "positive"
        },
        {
          "field": "Exceptional Items",
          "val1": "0.00",
          "val2": "0.00",
          "chgp": "",
          "chgp_class": "neutral"
        },
        {
          "field": "Consolidate Net Profit",
          "val1": "0.14",
          "val2": "-0.92",
          "chgp": "115.22%",
          "chgp_class": "positive"
        },
        {
          "field": "Operating Profit Margin (Excl OI)",
          "val1": "0.00%",
          "val2": "-457.14%",
          "chgp": "457.14%",
          "chgp_class": "positive"
        }
      ]
    }
  },
  {
    "link": "nine-monthly",
    "btn_text": "All Nine Monthly Results",
    "header": "Nine Monthly Results Snapshot (Consolidated) - Dec'24",
    "rhs": [
      {
        "prefix": "Net Sales ",
        "suffix": "YoY Growth in nine months ended Dec 2024 is -98.48% vs -12.03% in Dec 2023",
        "dir": -1
      },
      {
        "prefix": "Consolidated Net Profit ",
        "suffix": "YoY Growth in nine months ended Dec 2024 is 37.42% vs -7,850.00% in Dec 2023",
        "dir": 1
      }
    ],
    "table": {
      "header": [
        "Dec'24",
        "Dec'23",
        "Change(%)"
      ],
      "body": [
        {
          "field": "Net Sales",
          "val1": "0.14",
          "val2": "9.21",
          "chgp": "-98.48%",
          "chgp_class": "negative"
        },
        {
          "field": "Operating Profit (PBDIT) excl Other Income",
          "val1": "-1.03",
          "val2": "-1.08",
          "chgp": "4.63%",
          "chgp_class": "positive"
        },
        {
          "field": "Interest",
          "val1": "0.58",
          "val2": "0.64",
          "chgp": "-9.38%",
          "chgp_class": "positive"
        },
        {
          "field": "Exceptional Items",
          "val1": "0.00",
          "val2": "0.00",
          "chgp": "",
          "chgp_class": "neutral"
        },
        {
          "field": "Consolidate Net Profit",
          "val1": "-0.97",
          "val2": "-1.55",
          "chgp": "37.42%",
          "chgp_class": "positive"
        },
        {
          "field": "Operating Profit Margin (Excl OI)",
          "val1": "-735.71%",
          "val2": "-11.73%",
          "chgp": "-723.98%",
          "chgp_class": "negative"
        }
      ]
    }
  },
  {
    "link": "annual",
    "btn_text": "All Annual Results",
    "header": "Annual Results Snapshot (Consolidated) - Mar'25",
    "rhs": [
      {
        "prefix": "Net Sales ",
        "suffix": "YoY Growth in year ended Mar 2025 is -66.23% vs -14.27% in Mar 2024",
        "dir": -1
      },
      {
        "prefix": "Consolidated Net Profit ",
        "suffix": "YoY Growth in year ended Mar 2025 is 161.27% vs -325.00% in Mar 2024",
        "dir": 1
      }
    ],
    "table": {
      "header": [
        "Mar'25",
        "Mar'24",
        "Change(%)"
      ],
      "body": [
        {
          "field": "Net Sales",
          "val1": "3.59",
          "val2": "10.63",
          "chgp": "-66.23%",
          "chgp_class": "negative"
        },
        {
          "field": "Operating Profit (PBDIT) excl Other Income",
          "val1": "-0.08",
          "val2": "-1.42",
          "chgp": "94.37%",
          "chgp_class": "positive"
        },
        {
          "field": "Interest",
          "val1": "0.70",
          "val2": "0.81",
          "chgp": "-13.58%",
          "chgp_class": "positive"
        },
        {
          "field": "Exceptional Items",
          "val1": "0.00",
          "val2": "0.00",
          "chgp": "",
          "chgp_class": "neutral"
        },
        {
          "field": "Consolidate Net Profit",
          "val1": "1.25",
          "val2": "-2.04",
          "chgp": "161.27%",
          "chgp_class": "positive"
        },
        {
          "field": "Operating Profit Margin (Excl OI)",
          "val1": "-2.23%",
          "val2": "-13.36%",
          "chgp": "11.13%",
          "chgp_class": "positive"
        }
      ]
    }
  }
]
Quarterly Results Snapshot (Consolidated) - Sep'25 - YoYstock-summary
Sep'25
Sep'24
Change(%)
Net Sales
0.00
0.00
Operating Profit (PBDIT) excl Other Income
-0.23
-0.34
32.35%
Interest
0.03
0.20
-85.00%
Exceptional Items
0.00
0.00
Consolidate Net Profit
0.33
-0.47
170.21%
Operating Profit Margin (Excl OI)
0.00%
0.00%
NA
Values in Rs Cr.
Direction Arrows
Net Sales

YoY Growth in quarter ended Sep 2025 is 0.00% vs -100.00% in Sep 2024

Direction Arrows
Consolidated Net Profit

YoY Growth in quarter ended Sep 2025 is 170.21% vs -20.51% in Sep 2024

Half Yearly Results Snapshot (Consolidated) - Sep'25stock-summary
Sep'25
Sep'24
Change(%)
Net Sales
0.00
0.14
-100.00%
Operating Profit (PBDIT) excl Other Income
-0.50
-0.64
21.88%
Interest
0.06
0.38
-84.21%
Exceptional Items
0.00
0.00
Consolidate Net Profit
0.14
-0.92
115.22%
Operating Profit Margin (Excl OI)
0.00%
-457.14%
457.14%
Values in Rs Cr.
Direction Arrows
Net Sales

Growth in half year ended Sep 2025 is -100.00% vs -96.32% in Sep 2024

Direction Arrows
Consolidated Net Profit

Growth in half year ended Sep 2025 is 115.22% vs 6.12% in Sep 2024

Nine Monthly Results Snapshot (Consolidated) - Dec'24stock-summary
Dec'24
Dec'23
Change(%)
Net Sales
0.14
9.21
-98.48%
Operating Profit (PBDIT) excl Other Income
-1.03
-1.08
4.63%
Interest
0.58
0.64
-9.38%
Exceptional Items
0.00
0.00
Consolidate Net Profit
-0.97
-1.55
37.42%
Operating Profit Margin (Excl OI)
-735.71%
-11.73%
-723.98%
Values in Rs Cr.
Direction Arrows
Net Sales

YoY Growth in nine months ended Dec 2024 is -98.48% vs -12.03% in Dec 2023

Direction Arrows
Consolidated Net Profit

YoY Growth in nine months ended Dec 2024 is 37.42% vs -7,850.00% in Dec 2023

Annual Results Snapshot (Consolidated) - Mar'25stock-summary
Mar'25
Mar'24
Change(%)
Net Sales
3.59
10.63
-66.23%
Operating Profit (PBDIT) excl Other Income
-0.08
-1.42
94.37%
Interest
0.70
0.81
-13.58%
Exceptional Items
0.00
0.00
Consolidate Net Profit
1.25
-2.04
161.27%
Operating Profit Margin (Excl OI)
-2.23%
-13.36%
11.13%
Values in Rs Cr.
Direction Arrows
Net Sales

YoY Growth in year ended Mar 2025 is -66.23% vs -14.27% in Mar 2024

Direction Arrows
Consolidated Net Profit

YoY Growth in year ended Mar 2025 is 161.27% vs -325.00% in Mar 2024

stock-summaryCompany CV
About Prime Urban Development India Ltd stock-summary
stock-summary
Prime Urban Development India Ltd
Micro Cap
Realty
Prime Urban Development India Limited, was initially incorporated on 16 November, 1936 under the name and style of 'Asher Textiles Limited' was changed to ATL Textiles Limited on 15 June, 1993. Again on 20 June, 2000, ATL Textiles Limited was changed to Prime Textiles Limited and subsequently, on 05 July, 2010, the name was further changed to Prime Urban Development India Limited. The Company is having business of Realty development.
Company Coordinates stock-summary
Company Details
110 Avinashi Road, PB No 154 Gandhinagar P O Tirupur Tamil Nadu : 641603
stock-summary
Tel: 91-0422-4307800
stock-summary
companysecretary@ptlonline.com
Registrar Details
SKDC Consultants Ltd , Kanapathy Towers, 3rd Floor, Ganapathy, Coimbatore