
Compare Primo Chemicals with Similar Stocks
Dashboard
Poor long term growth as Operating profit has grown by an annual rate -30.88% of over the last 5 years
- PAT(Latest six months) At Rs 7.11 cr has Grown at 278.38%
- PBT LESS OI(Q) At Rs 2.16 cr has Grown at 1083.6% (vs previous 4Q average)
- DEBT-EQUITY RATIO(HY) Lowest at 0.32 times
With ROCE of 2.9, it has a Fair valuation with a 1.4 Enterprise value to Capital Employed
Majority shareholders : Non Institution
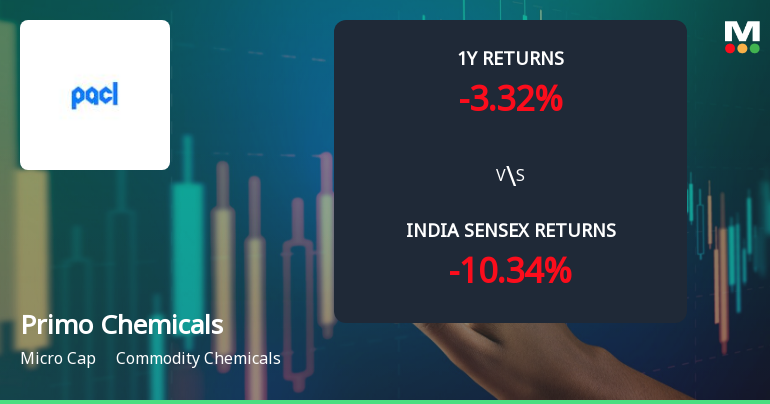
Consistent Underperformance against the benchmark over the last 3 years
Stock DNA
Commodity Chemicals
INR 590 Cr (Micro Cap)
39.00
41
0.00%
0.31
3.83%
1.44
Total Returns (Price + Dividend) 
Primo Chemicals for the last several years.
Risk Adjusted Returns v/s
Returns Beta

News
Primo Chemicals Ltd Technical Momentum Shifts to Bullish Amid Mixed Signals
Primo Chemicals Ltd has witnessed a notable shift in its technical parameters, moving from a mildly bullish stance to a more confident bullish momentum. Despite a marginal dip in price on 10 Jun 2026, the stock’s technical indicators such as MACD, moving averages, and KST suggest improving momentum, while some oscillators remain neutral or mixed. This nuanced technical picture offers investors a comprehensive view of the stock’s near-term potential within the commodity chemicals sector.
Read full news article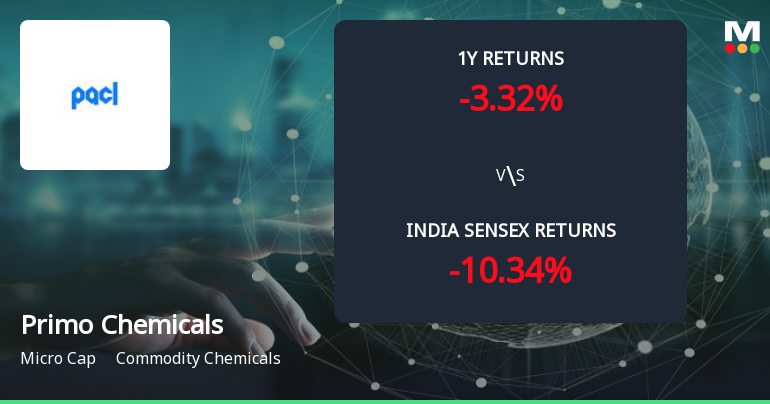
Golden Cross Forms in Primo Chemicals Ltd — On a Day the Stock Fell Slightly. What the Mixed Signals Mean
The 50-day moving average has crossed above the 200-day moving average for Primo Chemicals Ltd, signalling a golden cross on 09 Jun 2026. Yet, the stock slipped 0.04% on the day the cross formed, while monthly technical indicators remain only mildly bullish or even bearish in some cases. This divergence between the moving averages and other signals calls for a closer examination of the overall technical and fundamental context.
Read full news article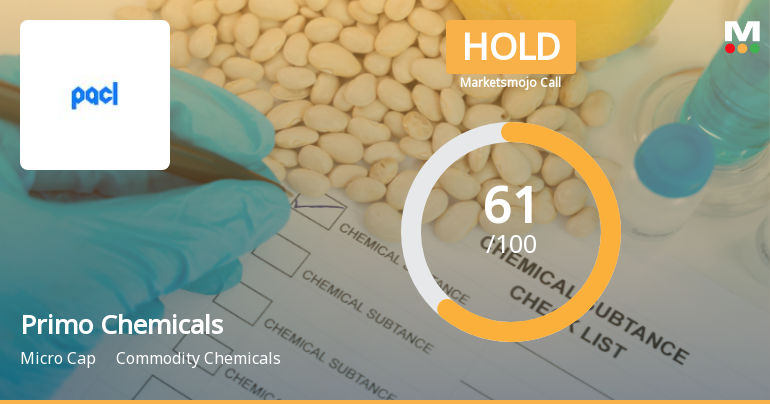
Primo Chemicals Ltd Upgraded to Hold as Technicals and Financials Improve
Primo Chemicals Ltd has seen its investment rating upgraded from Sell to Hold, reflecting a notable improvement in technical indicators and a shift in valuation metrics. The company’s recent financial performance, combined with a more favourable technical trend and fairer valuation, has prompted this reassessment, signalling cautious optimism for investors in this micro-cap commodity chemicals player.
Read full news article Announcements
Status Of Re-Lodgement Of Transfer Under Special Window.
04-Jun-2026 | Source : BSEAttached
Compliances-Reg.24(A)-Annual Secretarial Compliance
25-May-2026 | Source : BSEAttached.
Announcement under Regulation 30 (LODR)-Newspaper Publication
22-May-2026 | Source : BSEAttached.
Corporate Actions

No Upcoming Board Meetings

No Dividend history available

Primo Chemicals Ltd has announced 2:10 stock split, ex-date: 27 Jan 22

No Bonus history available

No Rights history available
Quality key factors
Valuation key factors
Technicals key factors
 Technical Indicator Scale: Bearish, Mildly Bearish, Sideways, Mildly Bullish, Bullish Turned
 Shareholding Snapshot : Mar 2026
Shareholding Compare (%holding)
Non Institution
None
Held by 11 Schemes (1.9%)
Held by 6 FIIs (0.08%)
Sukhbir Singh Dahiya (10.43%)
Naveen Chopra (16.51%)
27.23%
Quarterly Results Snapshot (Consolidated) - Mar'26 - QoQ

QoQ Growth in quarter ended Mar 2026 is 3.37% vs 4.01% in Dec 2025

QoQ Growth in quarter ended Mar 2026 is 478.10% vs -74.76% in Dec 2025
Half Yearly Results Snapshot (Consolidated) - Sep'25
Growth in half year ended Sep 2025 is 7.96% vs 26.20% in Sep 2024
Growth in half year ended Sep 2025 is 390.48% vs 109.75% in Sep 2024
Nine Monthly Results Snapshot (Consolidated) - Dec'25
YoY Growth in nine months ended Dec 2025 is 4.17% vs 35.87% in Dec 2024
YoY Growth in nine months ended Dec 2025 is 134.01% vs 112.25% in Dec 2024
Annual Results Snapshot (Consolidated) - Mar'26
YoY Growth in year ended Mar 2026 is 1.10% vs 39.95% in Mar 2025
YoY Growth in year ended Mar 2026 is 331.74% vs 114.05% in Mar 2025
About Primo Chemicals Ltd

Company Coordinates


