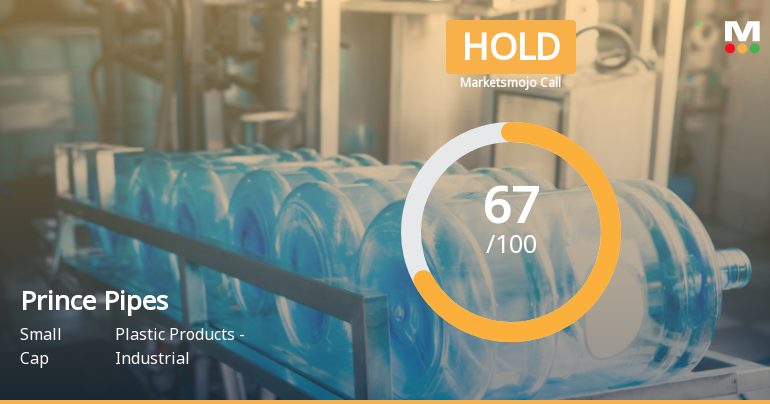
Prince Pipes

  • Market Cap: Small Cap
  • Industry: Plastic Products - Industrial
  • ISIN: INE689W01016
  • NSEID: PRINCEPIPE
  • BSEID: 542907
INR
283.00
-6.5 (-2.25%)
BSENSE

Sep 04, 03:30 PM

BSE+NSE Vol: 1.57 lacs

  • Price Points
  • Score
  • Mojo Parameters
  • Total Return
  • News and Corporate Actions
  • Key factors
  • Shareholding
  • Financials
  • CompanyCV
stock-summaryPrice Point
High/Low

1Day

52 Week

Valuation
Technical
Day's Volume

CASH

1.57 lacs (1.77%) Volume

Shareholding (Jun 2026)

FII

3.05%

Held by 55 FIIs

DII

15.34%

Held by 18 DIIs

Promoter

60.95%

Why is Prince Pipes & Fittings Ltd falling/rising?

06-Sep-2026

As of 05-Sep, the stock price of Prince Pipes & Fittings Ltd is currently Rs 282.80, reflecting a decline of 2.33%. The stock has shown negative trends over various periods, with significant decreases in price and investor participation, despite reporting positive financial results.

As of 05-Sep, the stock price of Prince Pipes & Fittings Ltd is falling, currently at Rs 282.80, which reflects a decrease of Rs 6.75 or 2.33%. This decline is evident in the stock's performance today, where it underperformed the sector by 2.5%. The stock touched an intraday low of Rs 281.1, indicating a drop of 2.92% during the trading session.<BR><BR>In terms of broader performance, the stock has shown a negative trend over various periods. Over the past week, it has decreased by 3.61%, and over the past year, it has fallen by 14.77%. Additionally, the stock's performance over three years shows a significant decline of 61.05%, contrasting sharply with the Sensex, which has gained 16.59% in the same period.<BR><BR>Investor participation appears to be declining as well, with the delivery volume on September 3 falling by 38.3% compared to the five-day average. This reduced interest may contribute to the stock's downward movement. Although the company has reported positive financial results, such as a 71.2% growth in profit before tax and a 79.4% increase in profit after tax compared to previous quarters, these gains have not translated into a rising stock price, which has been affected by broader market trends and investor sentiment. <BR><BR>Overall, the combination of recent price declines, underperformance relative to the sector, and decreasing investor participation are key factors contributing to the falling stock price of Prince Pipes & Fittings Ltd.

View full answer

Who are in the management team of Prince Pipes?

01-Sep-2026

The management team of Prince Pipes includes Executive Chairman Jayant Shamji Chheda, Executive Directors Parag and Vipul Jayant Chheda, and several Independent Non-Executive Directors, including Ramesh D Chandak and Uma Manoj Mandavgane, among others. They are responsible for the company's governance and strategic direction.

The management team of Prince Pipes includes the following key individuals:<BR><BR>1. **Jayant Shamji Chheda** - Executive Chairman & Managing Director<BR>2. **Parag Jayant Chheda** - Executive Director, Joint Managing Director, and Promoter<BR>3. **Vipul Jayant Chheda** - Executive Director<BR>4. **Ramesh D Chandak** - Independent Non-Executive Director<BR>5. **Uma Manoj Mandavgane** - Independent Non-Executive Director<BR>6. **Dilip Deshpande** - Independent Non-Executive Director<BR>7. **Rajendra V Gogri** - Independent Non-Executive Director<BR>8. **Amisha Vora** - Independent Non-Executive Director<BR><BR>This team plays a crucial role in the governance and strategic direction of the company.

View full answer

What does Prince Pipes do?

01-Sep-2026

Prince Pipes & Fittings Ltd is India's largest integrated piping solutions provider, specializing in plastic products. As of June 2026, it reported net sales of ₹609 Cr and a net profit of ₹34 Cr, with a market cap of ₹3,235 Cr.

Overview: <BR>Prince Pipes & Fittings Ltd is recognized as India's largest integrated piping solutions provider, operating in the Plastic Products - Industrial industry within the small-cap market segment.<BR><BR>History: <BR>The company was incorporated in 1987 as "Prince Pipes and Fittings Private Limited" and later converted to a public limited company, changing its name to "Prince Pipes and Fittings Limited" on August 11, 2017. The latest quarterly results reported net sales and net profit for June 2026.<BR><BR>Financial Snapshot: <BR>Most recent Net Sales: 609 Cr (Quarterly Results - Jun 2026) <BR>Most recent Net Profit: 34 Cr (Quarterly Results - Jun 2026) <BR>Market-cap value: INR 3,235 Cr (Small Cap)<BR><BR>Key Metrics: <BR>P/E: 32.00 <BR>Industry P/E: 34 <BR>Dividend Yield: 0.17% <BR>Debt-Equity: -0.08 <BR>Return on Equity: 6.21% <BR>Price to Book: 1.98 <BR><BR>Contact Details: <BR>Address: Plot No 1 Honda Indl Estat, Phase II Honda Sattari Honda Goa Goa : 403530 <BR>Tel: 91-22-66022222 <BR>Email: investors@princepipes.com <BR>Website: http://www.princepipes.com

View full answer

Who are the peers of the Prince Pipes?

01-Sep-2026

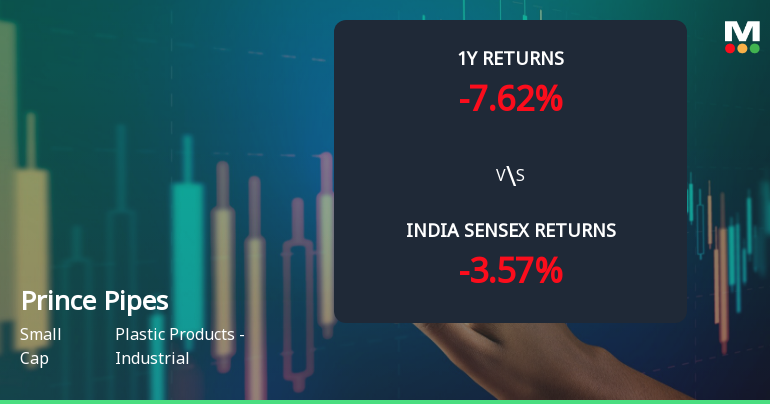
Prince Pipes' peers include Garware Hi Tech, Shaily Engineer, Finolex Inds., and others, with varying management risks and growth rates. Garware Hi Tech leads in 1-year returns at 165.29%, while Prince Pipes has a return of -7.62%.

Peers: The peers of Prince Pipes are Garware Hi Tech, Shaily Engineer., Finolex Inds., Time Technoplast, Kingfa Science, Apollo Pipes, Jain Irrigation, Jai Corp, and All Time Plastic.<BR><BR>Quality Snapshot: Excellent management risk is observed at Garware Hi Tech and Finolex Inds., while Good management risk is found at Shaily Engineer., Time Technoplast, and Kingfa Science. Average management risk is present at Prince Pipes, Apollo Pipes, and Premier Polyfilm, and Below Average management risk is noted at Jain Irrigation, Jai Corp, and All Time Plastic. Growth is Excellent at Kingfa Science, Good at Shaily Engineer., Time Technoplast, and Jain Irrigation, Below Average at Prince Pipes, Finolex Inds., Apollo Pipes, and the rest, and Below Average at Jai Corp, All Time Plastic, and the rest. Capital Structure is Excellent at Garware Hi Tech, Finolex Inds., Jai Corp, and Premier Polyfilm, Good at Shaily Engineer., Time Technoplast, and Apollo Pipes, and Below Average at Jain Irrigation.<BR><BR>Return Snapshot: The peer with the highest 1-year return is Garware Hi Tech at 165.29%, while the lowest is Jain Irrigation at -42.90%. Prince Pipes has a 1-year return of -7.62%, which is higher than Jain Irrigation's but lower than Garware Hi Tech's. Additionally, Finolex Inds., Jain Irrigation, Jai Corp, and All Time Plastic have negative six-month returns.

View full answer

How big is Prince Pipes?

01-Sep-2026

As of 31st August, Prince Pipes & Fittings Ltd has a market capitalization of 3,235.00 Cr, with net sales of 2,627.33 Cr and a net profit of 102.11 Cr over the latest four quarters.

As of 31st August, <BR><BR>Market Cap: Prince Pipes & Fittings Ltd has a market capitalization of 3,235.00 Cr and is classified as a Small Cap company.<BR><BR>Recent Quarterly Performance: The sum of Net Sales for the latest 4 quarters is 2,627.33 Cr, while the sum of Net Profit for the same period is 102.11 Cr.<BR><BR>Balance Sheet Snapshot: The reporting period for the balance sheet is March 2026. Shareholder's Funds are valued at 1,644.51 Cr, and Total Assets amount to 2,423.85 Cr.

View full answer

Should I buy, sell or hold Prince Pipes & Fittings Ltd?

01-Sep-2026

Are Prince Pipes & Fittings Ltd latest results good or bad?

05-Aug-2026

Prince Pipes & Fittings Ltd's latest results show a 600% year-on-year net profit growth to ₹33.75 crores, indicating strong profitability, but a 28.31% sequential revenue decline raises concerns about demand sustainability. Investors should watch future quarters for potential revenue recovery.

The latest results for Prince Pipes & Fittings Ltd present a mixed picture. On one hand, the company reported a significant year-on-year net profit growth of 600%, rising to ₹33.75 crores in Q1 FY27, which is a positive indicator of profitability. Additionally, the operating margins improved slightly to 12.66%, showcasing the company's ability to manage costs effectively despite revenue fluctuations.<BR><BR>However, the quarter also saw a notable sequential decline in revenue, which fell by 28.31% compared to the previous quarter, indicating potential challenges in demand sustainability. This decline is characteristic of seasonal trends in the construction sector, where the June quarter typically experiences lower activity levels.<BR><BR>Overall, while the profit growth is commendable, the sharp drop in revenue raises concerns about the company's performance in the near term. Investors should monitor future quarters to see if the profit improvements can be sustained alongside a recovery in revenue.

View full answer

When is the next results date for Prince Pipes & Fittings Ltd?

28-Jul-2026

The next results date for Prince Pipes & Fittings Ltd is August 4, 2026.

The next results date for Prince Pipes & Fittings Ltd is scheduled for August 4, 2026.

View full answer

Is Prince Pipes overvalued or undervalued?

11-Nov-2025

As of November 10, 2025, Prince Pipes is considered very expensive and overvalued with a PE ratio of 149.38, significantly higher than its peers, and has underperformed the Sensex with a year-to-date return of -27.07%.

As of 10 November 2025, the valuation grade for Prince Pipes has moved from expensive to very expensive. The company is currently overvalued, with a PE ratio of 149.38, an EV to EBIT of 103.69, and an EV to EBITDA of 24.17. In comparison, its peers such as Supreme Industries and Astral have significantly lower PE ratios of 57.96 and 82.76, respectively, indicating that Prince Pipes is trading at a premium relative to its industry.<BR><BR>The financial metrics further highlight the overvaluation, with a Price to Book Value of 0.22 and a ROE of only 0.15%. This suggests that investors are paying a high price for minimal returns. Additionally, the stock has underperformed against the Sensex, with a year-to-date return of -27.07% compared to the Sensex's gain of 6.91%, reinforcing the notion that the stock is overvalued in the current market environment.

View full answer

How has been the historical performance of Prince Pipes?

09-Nov-2025

Prince Pipes has experienced declining net sales and profitability from March 2022 to March 2025, with net sales dropping to 2,523.92 Cr and profit after tax falling to 43.14 Cr. Despite an increase in total assets, the company faces challenges in maintaining profitability amid rising costs and expenditures.

Answer:<BR>The historical performance of Prince Pipes shows a fluctuating trend in key financial metrics over the years leading up to March 2025.<BR><BR>Breakdown:<BR>Prince Pipes' net sales decreased from 2,710.87 Cr in March 2023 to 2,523.92 Cr in March 2025, reflecting a decline in total operating income as well. The raw material costs increased to 1,875.15 Cr in March 2025, up from 1,979.01 Cr in March 2023, while total expenditure also rose to 2,362.12 Cr in March 2025. Consequently, the operating profit (PBDIT) fell significantly from 421.08 Cr in March 2022 to 175.54 Cr in March 2025. Profit before tax showed a similar downward trend, dropping from 336.87 Cr in March 2022 to 58.85 Cr in March 2025, leading to a profit after tax of 43.14 Cr in March 2025, down from 249.40 Cr in March 2022. The company's total assets increased to 2,319.37 Cr in March 2025 from 1,928.75 Cr in March 2023, while total liabilities also rose to 2,319.37 Cr, indicating a growing debt level. Cash flow from operating activities improved to 118.00 Cr in March 2025, although cash flow from investing activities was negative at -234.00 Cr. Overall, the financial performance of Prince Pipes reflects challenges in profitability despite growth in asset size.

View full answer

Is Prince Pipes technically bullish or bearish?

07-Nov-2025

As of November 6, 2025, Prince Pipes is in a mildly bearish trend, with weekly indicators like the MACD and Bollinger Bands showing bearish momentum, despite a bullish monthly RSI and mildly bullish daily moving averages.

As of 6 November 2025, the technical trend for Prince Pipes has changed from sideways to mildly bearish. The current stance is bearish, driven primarily by the weekly MACD and Bollinger Bands both indicating bearish momentum. The KST and OBV are also showing mildly bearish signals on the weekly timeframe. Although the monthly RSI is bullish, the overall trend remains negative due to the prevailing bearish indicators across multiple timeframes. The daily moving averages are mildly bullish, but this is not enough to counter the bearish signals from the weekly data.

View full answer

Who are the top shareholders of the Prince Pipes?

17-Jul-2025

The top shareholders of Prince Pipes include promoter Vipul Jayant Chheda with 18.78%, mutual funds holding 14.79% (led by Mirae Asset Large & Midcap Fund at 9.65%), individual investors with 16.32%, and Foreign Institutional Investors at 6.19%. There are no pledged promoter holdings reported.

The top shareholders of Prince Pipes include a mix of promoters, mutual funds, and individual investors. The largest promoter is Vipul Jayant Chheda, who holds 18.78% of the shares. Mutual funds collectively hold 14.79% through seven different schemes, with the highest public shareholder being Mirae Asset Large & Midcap Fund at 9.65%. Additionally, individual investors own 16.32% of the company. Foreign Institutional Investors (FIIs) also have a stake, holding 6.19% through 75 different entities. There are no pledged promoter holdings reported.

View full answer

Has Prince Pipes declared dividend?

06-Jun-2025

Yes, Prince Pipes & Fittings Ltd has declared a 10% dividend, amounting to ₹1 per share, with an ex-date of September 4, 2024. Despite the dividend, the company has experienced significant price declines over the past few years, although it showed a strong recovery in the last five years.

Prince Pipes & Fittings Ltd has declared a 10% dividend.<BR><BR>Dividend Details:<BR>- Percentage announced: 10%<BR>- Amount per share: 1 per share<BR>- Ex-date: 04 Sep 24<BR><BR>Dividend Yield: 0.31%.<BR><BR>Total Returns by Period:<BR>In the last 6 months, the price return was -24.86%, the dividend return was 0%, resulting in a total return of -24.86%.<BR><BR>Over the past year, the price return was -46.63%, the dividend return was 0.15%, leading to a total return of -46.48%.<BR><BR>In the 2-year period, the price return was -48.51%, the dividend return was 0.15%, which resulted in a total return of -48.36%.<BR><BR>For the 3-year period, the price return was -46.23%, the dividend return was 0.53%, culminating in a total return of -45.7%.<BR><BR>During the 4-year period, the price return was -53.71%, the dividend return was 0.93%, resulting in a total return of -52.78%.<BR><BR>In the 5-year period, the price return was 190.27%, the dividend return was 7.05%, leading to a total return of 197.32%.<BR><BR>Overall, while Prince Pipes has declared a dividend, the total returns over various periods indicate significant declines in price returns, particularly in the short to medium term, with a notable recovery over the 5-year period.

View full answer
iScoreScore
Click here to find our call on this stock
Strong Sell
Sell
Hold
Buy
Strong Buy

Dashboard

1

Company has a Debt to Equity ratio (avg) of 0.04 times

 
2

Poor long term growth as Operating profit has grown by an annual rate -15.42% of over the last 5 years

 
3

Positive results in Jun 26

4

With ROE of 6.2, it has a Very Attractive valuation with a 1.9 Price to Book Value

5

Falling Participation by Institutional Investors

6

Consistent Underperformance against the benchmark over the last 3 years

stock-summaryMojo Parameters

Mojo Parameters

Loading Valuation Snapshot...

Stock DNA

stock-summary
Industry

Plastic Products - Industrial

stock-summary
Market cap

INR 3,172 Cr (Small Cap)

stock-summary
P/E

31.00

stock-summary
Industry P/E

33

stock-summary
Dividend Yield

0.17%

stock-summary
Debt Equity

-0.08

stock-summary
Return on Equity

6.21%

stock-summary
Price to Book

1.94

Revenue and Profits:
Net Sales:
609 Cr
(Quarterly Results - Jun 2026)
Net Profit:
34 Cr
stock-summaryTotal Returns
Total Returns (Price + Dividend) stock-summary
Dividend Yield (0.17%)
TimePeriod
Price Return
Dividend Return
Total Return
3 Months
3.68%
0.35%
4.03%
6 Months
19.92%
0.38%
20.3%
1 Year
-14.58%
0.30%
-14.28%
2 Years
-50.32%
0.26%
-50.06%
3 Years
-60.93%
0.36%
-60.57%
4 Years
-52.28%
0.43%
-51.85%
5 Years
-57.45%
0.83%
-56.62%

Latest dividend: 0.5 per share ex-dividend date: Sep-04-2025

Risk Adjusted Returns v/s stock-summary
Returns Beta
Icon
Beta has not been calculated since enough price history is not available
stock-summaryNews & Corporate Actions

News

Prince Pipes & Fittings Ltd Falls 3.61%: Mixed Signals Mark a Cautious Week

Announcements stock-summary

Icon
No announcement available

Corporate Actions stock-summary

stock-summary
BOARD MEETING

No Upcoming Board Meetings

stock-summary
DIVIDEND

Prince Pipes & Fittings Ltd has declared 5% dividend, ex-date: 04 Sep 25

stock-summary
SPLITS

No Splits history available

stock-summary
BONUS

No Bonus history available

stock-summary
RIGHTS

No Rights history available

stock-summaryKey Factors

Quality key factors stock-summary

Factor
Value
Sales Growth (5y)
4.59%
EBIT Growth (5y)
-15.42%
EBIT to Interest (avg)
19.31
Debt to EBITDA (avg)
0.66
Net Debt to Equity (avg)
-0.08
Sales to Capital Employed (avg)
1.67
Tax Ratio
24.70%
Dividend Payout Ratio
12.82%
Pledged Shares
0
Institutional Holding
18.39%
ROCE (avg)
14.45%
ROE (avg)
9.35%

Valuation key factors

Factor
Value
P/E Ratio
31
Industry P/E
33
Price to Book Value
1.90
EV to EBIT
22.32
EV to EBITDA
11.11
EV to Capital Employed
1.98
EV to Sales
1.14
PEG Ratio
0.09
Dividend Yield
0.18%
ROCE (Latest)
6.68%
ROE (Latest)
6.21%

Technicals key factors

Indicator
Weekly
Monthly
MACD
Bullish
Mildly Bullish
RSI
No Signal
No Signal
Bollinger Bands
Mildly Bullish
Sideways
Moving Averages
Bullish (Daily)
KST
Mildly Bearish
Mildly Bullish
Dow Theory
Mildly Bullish
No Trend
OBV
No Trend
No Trend
stock-summary Technical Indicator Scale: Bearish, Mildly Bearish, Sideways, Mildly Bullish, Bullish  Turned 
stock-summaryShareholding
Shareholding Snapshot : Jun 2026stock-summary
Shareholding Compare (%holding) stock-summary
Majority shareholders

Promoters

Pledged Promoter Holdings

None

Mutual Funds

Held by 4 Schemes (15.26%)

FIIs

Held by 55 FIIs (3.05%)

Promoter with highest holding

Parag Jayant Chheda (11.27%)

Highest Public shareholder

Mirae Asset Large & Midcap Fund (9.83%)

Individual Investors Holdings

18.5%

stock-summaryFinancial
[
  {
    "link": "quarterly",
    "btn_text": "All Quarterly Results",
    "header": "Quarterly Results Snapshot (Standalone) - Jun'26 - QoQ",
    "rhs": [
      {
        "prefix": "Net Sales ",
        "suffix": "QoQ Growth in quarter ended Jun 2026 is -28.31% vs 48.28% in Mar 2026",
        "dir": -1
      },
      {
        "prefix": "Standalone Net Profit ",
        "suffix": "QoQ Growth in quarter ended Jun 2026 is -39.85% vs 2,457.56% in Mar 2026",
        "dir": -1
      }
    ],
    "table": {
      "header": [
        "Jun'26",
        "Mar'26",
        "Change(%)"
      ],
      "body": [
        {
          "field": "Net Sales",
          "val1": "609.42",
          "val2": "850.07",
          "chgp": "-28.31%",
          "chgp_class": "negative"
        },
        {
          "field": "Operating Profit (PBDIT) excl Other Income",
          "val1": "77.16",
          "val2": "109.62",
          "chgp": "-29.61%",
          "chgp_class": "negative"
        },
        {
          "field": "Interest",
          "val1": "3.24",
          "val2": "4.29",
          "chgp": "-24.48%",
          "chgp_class": "positive"
        },
        {
          "field": "Exceptional Items",
          "val1": "0.00",
          "val2": "0.00",
          "chgp": "",
          "chgp_class": "neutral"
        },
        {
          "field": "Standalone Net Profit",
          "val1": "33.75",
          "val2": "56.11",
          "chgp": "-39.85%",
          "chgp_class": "negative"
        },
        {
          "field": "Operating Profit Margin (Excl OI)",
          "val1": "12.66%",
          "val2": "12.90%",
          "chgp": "-0.24%",
          "chgp_class": "negative"
        }
      ]
    }
  },
  {
    "link": "half-yearly",
    "btn_text": "All Half Yearly Results",
    "header": "Half Yearly Results Snapshot (Standalone) - Sep'25",
    "rhs": [
      {
        "prefix": "Net Sales ",
        "suffix": " Growth in half year ended Sep 2025 is -4.20% vs 1.37% in Sep 2024",
        "dir": -1
      },
      {
        "prefix": "Standalone Net Profit ",
        "suffix": " Growth in half year ended Sep 2025 is -50.61% vs -56.37% in Sep 2024",
        "dir": 1
      }
    ],
    "table": {
      "header": [
        "Sep'25",
        "Sep'24",
        "Change(%)"
      ],
      "body": [
        {
          "field": "Net Sales",
          "val1": "1,174.99",
          "val2": "1,226.54",
          "chgp": "-4.20%",
          "chgp_class": "negative"
        },
        {
          "field": "Operating Profit (PBDIT) excl Other Income",
          "val1": "94.67",
          "val2": "103.99",
          "chgp": "-8.96%",
          "chgp_class": "negative"
        },
        {
          "field": "Interest",
          "val1": "9.69",
          "val2": "3.09",
          "chgp": "213.59%",
          "chgp_class": "negative"
        },
        {
          "field": "Exceptional Items",
          "val1": "0.00",
          "val2": "0.00",
          "chgp": "",
          "chgp_class": "neutral"
        },
        {
          "field": "Standalone Net Profit",
          "val1": "19.45",
          "val2": "39.38",
          "chgp": "-50.61%",
          "chgp_class": "negative"
        },
        {
          "field": "Operating Profit Margin (Excl OI)",
          "val1": "8.06%",
          "val2": "8.48%",
          "chgp": "-0.42%",
          "chgp_class": "negative"
        }
      ]
    }
  },
  {
    "link": "nine-monthly",
    "btn_text": "All Nine Monthly Results",
    "header": "Nine Monthly Results Snapshot (Standalone) - Dec'25",
    "rhs": [
      {
        "prefix": "Net Sales ",
        "suffix": "YoY Growth in nine months ended Dec 2025 is -3.10% vs -1.33% in Dec 2024",
        "dir": -1
      },
      {
        "prefix": "Standalone Net Profit ",
        "suffix": "YoY Growth in nine months ended Dec 2025 is -9.97% vs -85.17% in Dec 2024",
        "dir": 1
      }
    ],
    "table": {
      "header": [
        "Dec'25",
        "Dec'24",
        "Change(%)"
      ],
      "body": [
        {
          "field": "Net Sales",
          "val1": "1,748.26",
          "val2": "1,804.26",
          "chgp": "-3.10%",
          "chgp_class": "negative"
        },
        {
          "field": "Operating Profit (PBDIT) excl Other Income",
          "val1": "122.56",
          "val2": "108.66",
          "chgp": "12.79%",
          "chgp_class": "positive"
        },
        {
          "field": "Interest",
          "val1": "5.93",
          "val2": "8.16",
          "chgp": "-27.33%",
          "chgp_class": "positive"
        },
        {
          "field": "Exceptional Items",
          "val1": "0.00",
          "val2": "0.00",
          "chgp": "",
          "chgp_class": "neutral"
        },
        {
          "field": "Standalone Net Profit",
          "val1": "17.07",
          "val2": "18.96",
          "chgp": "-9.97%",
          "chgp_class": "negative"
        },
        {
          "field": "Operating Profit Margin (Excl OI)",
          "val1": "7.01%",
          "val2": "6.02%",
          "chgp": "0.99%",
          "chgp_class": "positive"
        }
      ]
    }
  },
  {
    "link": "annual",
    "btn_text": "All Annual Results",
    "header": "Annual Results Snapshot (Standalone) - Mar'26",
    "rhs": [
      {
        "prefix": "Net Sales ",
        "suffix": "YoY Growth in year ended Mar 2026 is 2.95% vs -1.75% in Mar 2025",
        "dir": 1
      },
      {
        "prefix": "Standalone Net Profit ",
        "suffix": "YoY Growth in year ended Mar 2026 is 69.63% vs -76.36% in Mar 2025",
        "dir": 1
      }
    ],
    "table": {
      "header": [
        "Mar'26",
        "Mar'25",
        "Change(%)"
      ],
      "body": [
        {
          "field": "Net Sales",
          "val1": "2,598.33",
          "val2": "2,523.92",
          "chgp": "2.95%",
          "chgp_class": "positive"
        },
        {
          "field": "Operating Profit (PBDIT) excl Other Income",
          "val1": "231.60",
          "val2": "163.11",
          "chgp": "41.99%",
          "chgp_class": "positive"
        },
        {
          "field": "Interest",
          "val1": "9.62",
          "val2": "10.65",
          "chgp": "-9.67%",
          "chgp_class": "positive"
        },
        {
          "field": "Exceptional Items",
          "val1": "0.00",
          "val2": "0.00",
          "chgp": "",
          "chgp_class": "neutral"
        },
        {
          "field": "Standalone Net Profit",
          "val1": "73.18",
          "val2": "43.14",
          "chgp": "69.63%",
          "chgp_class": "positive"
        },
        {
          "field": "Operating Profit Margin (Excl OI)",
          "val1": "8.91%",
          "val2": "6.46%",
          "chgp": "2.45%",
          "chgp_class": "positive"
        }
      ]
    }
  }
]

Quarterly Results Snapshot (Standalone) - Jun'26 - QoQstock-summary

Jun'26
Mar'26
Change(%)
Net Sales
609.42
850.07
-28.31%
Operating Profit (PBDIT) excl Other Income
77.16
109.62
-29.61%
Interest
3.24
4.29
-24.48%
Exceptional Items
0.00
0.00
Standalone Net Profit
33.75
56.11
-39.85%
Operating Profit Margin (Excl OI)
12.66%
12.90%
-0.24%
Values in Rs Cr.
Direction Arrows
Net Sales

QoQ Growth in quarter ended Jun 2026 is -28.31% vs 48.28% in Mar 2026

Direction Arrows
Standalone Net Profit

QoQ Growth in quarter ended Jun 2026 is -39.85% vs 2,457.56% in Mar 2026

Half Yearly Results Snapshot (Standalone) - Sep'25stock-summary

Sep'25
Sep'24
Change(%)
Net Sales
1,174.99
1,226.54
-4.20%
Operating Profit (PBDIT) excl Other Income
94.67
103.99
-8.96%
Interest
9.69
3.09
213.59%
Exceptional Items
0.00
0.00
Standalone Net Profit
19.45
39.38
-50.61%
Operating Profit Margin (Excl OI)
8.06%
8.48%
-0.42%
Values in Rs Cr.
Direction Arrows
Net Sales

Growth in half year ended Sep 2025 is -4.20% vs 1.37% in Sep 2024

Direction Arrows
Standalone Net Profit

Growth in half year ended Sep 2025 is -50.61% vs -56.37% in Sep 2024

Nine Monthly Results Snapshot (Standalone) - Dec'25stock-summary

Dec'25
Dec'24
Change(%)
Net Sales
1,748.26
1,804.26
-3.10%
Operating Profit (PBDIT) excl Other Income
122.56
108.66
12.79%
Interest
5.93
8.16
-27.33%
Exceptional Items
0.00
0.00
Standalone Net Profit
17.07
18.96
-9.97%
Operating Profit Margin (Excl OI)
7.01%
6.02%
0.99%
Values in Rs Cr.
Direction Arrows
Net Sales

YoY Growth in nine months ended Dec 2025 is -3.10% vs -1.33% in Dec 2024

Direction Arrows
Standalone Net Profit

YoY Growth in nine months ended Dec 2025 is -9.97% vs -85.17% in Dec 2024

Annual Results Snapshot (Standalone) - Mar'26stock-summary

Mar'26
Mar'25
Change(%)
Net Sales
2,598.33
2,523.92
2.95%
Operating Profit (PBDIT) excl Other Income
231.60
163.11
41.99%
Interest
9.62
10.65
-9.67%
Exceptional Items
0.00
0.00
Standalone Net Profit
73.18
43.14
69.63%
Operating Profit Margin (Excl OI)
8.91%
6.46%
2.45%
Values in Rs Cr.
Direction Arrows
Net Sales

YoY Growth in year ended Mar 2026 is 2.95% vs -1.75% in Mar 2025

Direction Arrows
Standalone Net Profit

YoY Growth in year ended Mar 2026 is 69.63% vs -76.36% in Mar 2025

stock-summaryCompany CV
About Prince Pipes & Fittings Ltd stock-summary
stock-summary
Prince Pipes & Fittings Ltd
Small Cap
Plastic Products - Industrial
Prince Pipes and Fittings Limited (PPFL) was incorporated as a private Company as "Prince Pipes and Fittings Private Limited" on November 13, 1987, in Mumbai, Maharashtra. Thereafter, the Company got converted into a public Limited and the name of the Company was changed to "Prince Pipes and Fittings Limited" on August 11, 2017. The Company is recognized as India's largest integrated piping solutions providers based in Mumbai.
Company Coordinates stock-summary
Company Details
Plot No 1 Honda Indl Estat, Phase II Honda Sattari Honda Goa Goa : 403530
stock-summary
Tel: 91-22-66022222
stock-summary
investors@princepipes.com
Registrar Details