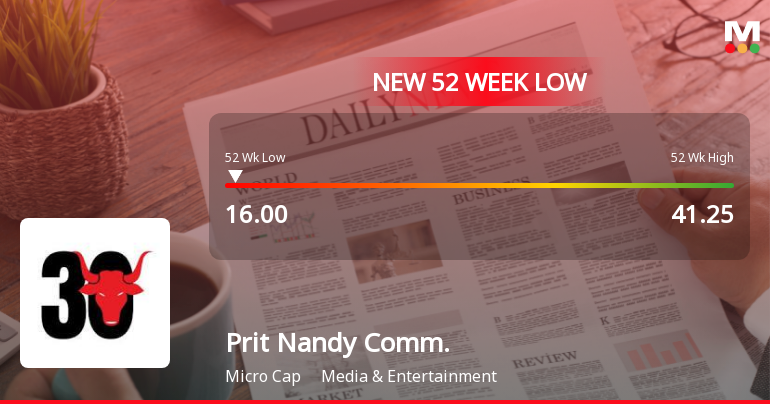
Prit Nandy Comm.

  • Market Cap: Micro Cap
  • Industry: Media & Entertainment
  • ISIN: INE392B01011
  • NSEID: PNC
  • BSEID: 532387
INR
20.00
-0.12 (-0.6%)
BSENSE

Jul 17, 03:30 PM

BSE+NSE Vol: 6.24 k

  • Price Points
  • Score
  • Mojo Parameters
  • Total Return
  • News and Corporate Actions
  • Key factors
  • Shareholding
  • Financials
  • CompanyCV
stock-summaryPrice Point
High/Low

1Day

52 Week

Valuation
Technical
Day's Volume

CASH

6.24 k (-92.42%) Volume

Shareholding (Jun 2026)

FII

0.00%

Held by 0 FIIs

DII

0.00%

Held by 0 DIIs

Promoter

59.72%

Why is Pritish Nandy Communications Ltd falling/rising?

18-Jul-2026

As of 18-Jul, Pritish Nandy Communications Ltd's stock price is at 20.00, down 0.6%, and has significantly underperformed the Sensex over various time frames, including a year-to-date drop of 25.26%. The stock is trading below all moving averages, indicating a bearish trend, compounded by a sharp decline in investor participation.

As of 18-Jul, Pritish Nandy Communications Ltd's stock price is falling, currently at 20.00, reflecting a change of -0.12 (-0.6%). The stock has underperformed against the benchmark Sensex, which has increased by 0.75% over the past week, while Pritish Nandy's stock has declined by 1.82%. Over the past month, the stock has decreased by 3.75%, contrasting with the Sensex's gain of 1.29%. Year-to-date, the stock has seen a significant drop of 25.26%, compared to the Sensex's decline of only 8.30%. <BR><BR>The stock's performance over longer periods is also concerning, with a 1-year decline of 33.95% versus the Sensex's 4.99% drop, and a staggering 51.81% decrease over the last five years compared to the Sensex's 47.07% increase. Additionally, Pritish Nandy Communications Ltd is trading below its moving averages across all time frames, including the 5-day, 20-day, 50-day, 100-day, and 200-day averages, indicating a bearish trend. <BR><BR>Investor participation has also fallen sharply, with a delivery volume of only 4.32k on 16 July, which is down by 91% compared to the 5-day average. This decline in trading activity suggests a lack of confidence among investors, contributing to the stock's downward movement. Overall, the combination of poor performance relative to the market, declining investor interest, and trading below moving averages are key factors driving the stock price lower.

View full answer

How big is Prit Nandy Comm.?

11-Jun-2026

As of 10th June, Pritish Nandy Communications Ltd has a market capitalization of 28.00 Cr and reported net sales of 37.66 Cr with a net loss of 12.53 Cr over the latest four quarters.

As of 10th June, Pritish Nandy Communications Ltd has a market capitalization of 28.00 Cr, which classifies it as a Micro Cap company.<BR><BR>In the latest four quarters, the company reported net sales of 37.66 Cr. However, it experienced a net loss of 12.53 Cr during the same period.<BR><BR>The latest annual period for the balance sheet is March 2025, showing shareholder's funds of 73.57 Cr and total assets of 101.18 Cr.

View full answer

Who are in the management team of Prit Nandy Comm.?

11-Jun-2026

The management team of Prit Nandy Communications includes Pritish Nandy (Chairman), Rina Pritish Nandy (Director), Pallab Bhattacharya (Vice Chairman & CEO), Rangita Pritish Nandy (Director), and several independent directors: Raghu R Palat, Pradeep Guha, Sunil Alagh, Karan Ahluwalia, and Neerja Shah. This diverse team brings extensive experience and leadership to the company.

The management team of Prit Nandy Communications includes the following individuals:<BR><BR>1. **Pritish Nandy** - Chairman<BR>2. **Rina Pritish Nandy** - Director<BR>3. **Pallab Bhattacharya** - Vice Chairman & CEO, and also serves as Whole Time Director<BR>4. **Rangita Pritish Nandy** - Director<BR>5. **Raghu R Palat** - Independent Director<BR>6. **Pradeep Guha** - Independent Director<BR>7. **Sunil Alagh** - Additional Independent Director<BR>8. **Karan Ahluwalia** - Additional Independent Director<BR>9. **Neerja Shah** - Additional Independent Director<BR><BR>This team brings a diverse range of experience and leadership to the company.

View full answer

Who are the peers of the Prit Nandy Comm.?

11-Jun-2026

Prit Nandy Comm.'s peers include Cyber Media Ind, Diligent Media, Next Mediaworks, and others, with varying management risks and growth rates. Cyber Media Ind has the highest 1-year return at 6.92%, while Diligent Media has the lowest at -45.28%; Prit Nandy Comm. has a return of -27.30%.

Peers: The peers of Prit Nandy Comm. are Cyber Media Ind, Diligent Media, Next Mediaworks, Identical Brains, Sharpline Broadc, Thinkink Picture, Shalimar Prod., Winpro Industrie, and Picturehouse.<BR><BR>Quality Snapshot: Below Average management risk is observed at Prit Nandy Comm., Next Mediaworks, Diligent Media, Cyber Media Ind, Sharpline Broadc, and Shalimar Prod., while Good management risk is found at Identical Brains. Average management risk is noted at Thinkink Picture and Winpro Industrie. Growth is Average at Prit Nandy Comm. and Identical Brains, while Below Average growth is seen at Diligent Media, Next Mediaworks, Sharpline Broadc, Shalimar Prod., and the rest. Excellent growth is only observed at Sharpline Broadc. Capital Structure ratings show Below Average at Prit Nandy Comm., Cyber Media Ind, Diligent Media, Next Mediaworks, and the rest, while Good capital structure is noted at Identical Brains, Thinkink Picture, Shalimar Prod., and Winpro Industrie.<BR><BR>Return Snapshot: The peer with the highest 1-year return is Cyber Media Ind at 6.92%, while the lowest is Diligent Media at -45.28%. Prit Nandy Comm.'s 1-year return is -27.30%, which is higher than Diligent Media but lower than Cyber Media Ind. Additionally, several peers, including Diligent Media, Next Mediaworks, and Identical Brains, have negative six-month returns.

View full answer

What does Prit Nandy Comm. do?

10-Jun-2026

Pritish Nandy Communications Ltd produces and distributes content such as films and TV series in the Media & Entertainment industry. As of March 2026, it reported net sales of 2 Cr and a net loss of 2 Cr, with a market cap of INR 28 Cr.

Overview:<BR>Pritish Nandy Communications Ltd is engaged in the production and exploitation of content, including cinematographic films, TV serials, and digital series, within the Media & Entertainment industry and operates as a micro-cap company.<BR><BR>History:<BR>The company was incorporated in September 1993 as Pritish Nandy Communications Pvt Ltd and was converted into a public company in March 2000, subsequently renamed Pritish Nandy Communications Limited (PNCL). The latest quarterly results reported net sales and net profit for the period ending March 2026.<BR><BR>Financial Snapshot:<BR>Most recent Net Sales: 2 Cr (Quarterly Results - Mar 2026) <BR>Most recent Net Profit: -2 Cr (Quarterly Results - Mar 2026) <BR>Market-cap value: INR 28 Cr (Micro Cap)<BR><BR>Key Metrics:<BR>P/E: 6.00 <BR>Industry P/E: 62 <BR>Dividend Yield: 0.00% <BR>Debt-Equity: 0.01 <BR>Return on Equity: 8.18% <BR>Price to Book: 0.47 <BR><BR>Contact Details:<BR>Address: 87/88 Mittal Chambers, Nariman Point Mumbai Maharashtra : 400021 <BR>Tel: 91-022-42130000 <BR>Email: investorgrievance@pritishnandycom.c <BR>Website: http://www.pritishnandycom.com

View full answer

Should I buy, sell or hold Pritish Nandy Communications Ltd?

28-May-2026

Are Pritish Nandy Communications Ltd latest results good or bad?

27-May-2026

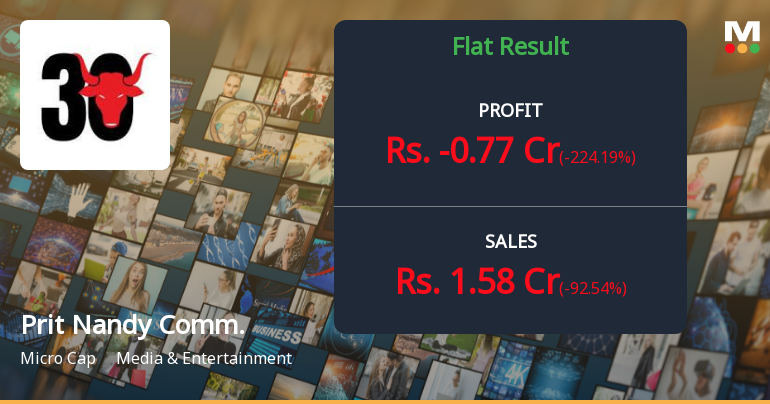
Pritish Nandy Communications Ltd's latest results are concerning, showing a net loss of ₹2.06 crores and a 74.51% drop in revenue, indicating significant operational distress and a bleak outlook for the company. The stock has also underperformed, down 31.93% over the past year, reflecting a lack of investor confidence.

Pritish Nandy Communications Ltd's latest results are concerning and indicate significant operational distress. In the fourth quarter of FY26, the company reported a net profit of ₹-2.06 crores, which represents a staggering 479.07% decline compared to the previous quarter. Revenue also fell sharply by 74.51% quarter-on-quarter, totaling just ₹2.49 crores, marking a 68.04% decrease year-on-year.<BR><BR>The operating margin has plunged to a negative 82.33%, a drastic drop from the previous quarter's positive margin of 21.90%. This suggests that the company is spending significantly more to generate revenue than it is earning, raising serious questions about its financial health and operational efficiency.<BR><BR>Additionally, the stock has underperformed considerably, down 31.93% over the past year and trading well below its 52-week high. The absence of institutional holdings further reflects a lack of confidence among investors. Overall, these results paint a picture of a company facing severe challenges, and the outlook appears bleak without significant operational improvements.

View full answer

When is the next results date for Pritish Nandy Communications Ltd?

03-Feb-2026

The next results date for Pritish Nandy Communications Ltd is 12 February 2026.

The next results date for Pritish Nandy Communications Ltd is scheduled for 12 February 2026.

View full answer

How has been the historical performance of Prit Nandy Comm.?

17-Nov-2025

Prit Nandy Comm. experienced significant fluctuations in financial performance, with net sales and profits declining sharply from Mar'24 to Mar'25, while total assets and liabilities increased. Despite a downturn in profitability, cash flow from operating activities improved.

Answer:<BR>The historical performance of Prit Nandy Comm. shows significant fluctuations in key financial metrics over the years.<BR><BR>Breakdown:<BR>Prit Nandy Comm. experienced varying net sales, with a peak of 57.72 Cr in Mar'24, followed by a decline to 33.60 Cr in Mar'25. The total operating income mirrored this trend, decreasing from 57.72 Cr in Mar'24 to 33.60 Cr in Mar'25. The company faced challenges with total expenditure, which was 35.28 Cr in Mar'25, leading to an operating profit (PBDIT) of -1.00 Cr, a stark contrast to the positive 2.80 Cr in Mar'24. This resulted in a profit before tax of -1.39 Cr in Mar'25, down from 2.39 Cr in the previous year. The profit after tax also reflected this downturn, falling to -0.95 Cr in Mar'25 from 2.42 Cr in Mar'24. The earnings per share (EPS) showed a similar decline, dropping to -0.66 in Mar'25 from 1.67 in Mar'24. On the balance sheet, total assets increased to 101.18 Cr in Mar'25 from 98.83 Cr in Mar'24, while total liabilities also rose to 101.18 Cr from 98.83 Cr, indicating a consistent leverage. Cash flow from operating activities improved to 4.00 Cr in Mar'25 from 2.00 Cr in Mar'24, contributing to a net cash inflow of 5.00 Cr in Mar'25, up from 3.00 Cr in the prior year. Overall, the financial performance of Prit Nandy Comm. reflects a challenging environment with notable declines in profitability despite some improvements in cash flow.

View full answer

Is Prit Nandy Comm. overvalued or undervalued?

09-Jun-2025

As of February 10, 2025, Prit Nandy Communications is considered undervalued despite troubling financial ratios, with a shift in valuation from expensive to risky, highlighted by a negative PE ratio of -40.54 and poor stock performance, contrasting sharply with the Sensex's positive return.

As of 10 February 2025, the valuation grade for Prit Nandy Communications has moved from expensive to risky, indicating a shift in perception regarding its financial health. The company is currently considered undervalued, despite its troubling financial ratios. The PE ratio stands at -40.54, while the Price to Book Value is at 0.55, and the EV to Sales ratio is 0.99, suggesting that the market may be undervaluing its assets relative to its earnings potential.<BR><BR>Although peer valuation data is not available for direct comparison, the negative ROCE of -2.99% and ROE of -1.30% highlight significant operational challenges. The company's recent stock performance has been poor, with a year-to-date return of -49.86%, contrasting sharply with the Sensex's positive return of 5.59% over the same period. This disparity reinforces the notion that Prit Nandy Communications may be undervalued in the current market environment.

View full answer

What is the technical trend for Prit Nandy Comm.?

09-Jun-2025

As of May 12, 2025, Prit Nandy Comm. shows a mildly bearish trend overall, with conflicting indicators: weekly MACD and KST are mildly bullish, while monthly signals from moving averages and Bollinger Bands remain bearish.

As of 12 May 2025, the technical trend for Prit Nandy Comm. has changed from bearish to mildly bearish. The weekly MACD indicates a mildly bullish stance, while the monthly MACD remains bearish. The daily moving averages are mildly bearish, and both the weekly and monthly Bollinger Bands are bearish. The KST shows a mildly bullish trend on the weekly but bearish on the monthly. Dow Theory supports a mildly bullish outlook on both weekly and monthly time frames. Overall, the current technical stance is mildly bearish, driven primarily by the bearish signals from moving averages and Bollinger Bands, despite some mildly bullish indicators in the MACD and KST on the weekly chart.

View full answer

Who are the top shareholders of the Prit Nandy Comm.?

06-Jun-2025

The top shareholders of Prit Nandy Comm. include Ideas.com India Private Limited with 16.72%, Bharati Kamal Morarka at 10.34%, and individual investors holding 39.07%. There are no pledged promoter holdings, and one Foreign Institutional Investor holds a negligible 0.0%.

The top shareholders of Prit Nandy Comm. include the promoters, who hold the majority of the shares. The promoter with the highest holding is Ideas.com India Private Limited, which owns 16.72% of the company. The highest public shareholder is Bharati Kamal Morarka, holding 10.34%. Additionally, individual investors collectively hold 39.07% of the shares. There are no pledged promoter holdings, and the company has one Foreign Institutional Investor (FII) with a negligible holding of 0.0%.

View full answer

Has Prit Nandy Comm. declared dividend?

06-Jun-2025

Pritish Nandy Communications Ltd has declared a 10% dividend, amounting to 1 per share, with an ex-date of September 11, 2008. However, the company has faced significant price declines over most periods, resulting in a total return of -55.98% over the last 6 months and a lack of dividend yield.

Pritish Nandy Communications Ltd has declared a 10% dividend.<BR><BR>Dividend Details:<BR>- Percentage announced: 10%<BR>- Amount per share: 1 per share<BR>- Ex-date: Sep-11-2008<BR><BR>Dividend Yield: 0%<BR><BR>Total Returns by Period:<BR>In the 6-month period, the price return was -55.98%, the dividend return was 0%, resulting in a total return of -55.98%.<BR><BR>For the 1-year period, the price return was -54.31%, the dividend return was 0%, leading to a total return of -54.31%.<BR><BR>Over the 2-year period, the price return was -24.49%, the dividend return was 0%, which resulted in a total return of -24.49%.<BR><BR>In the 3-year period, the price return was -39.02%, the dividend return was 0%, culminating in a total return of -39.02%.<BR><BR>For the 4-year period, the price return was -36.96%, the dividend return was 0%, yielding a total return of -36.96%.<BR><BR>Finally, in the 5-year period, the price return was 109.57%, the dividend return was 0%, resulting in a total return of 109.57%.<BR><BR>Overall, while Pritish Nandy Communications Ltd has declared a dividend, the company has experienced significant price declines over most periods, with only the 5-year period showing a positive total return. The lack of dividend yield indicates that the dividend has not been a significant contributor to returns in recent years.

View full answer
iScoreScore
Click here to find our call on this stock
Strong Sell
Sell
Hold
Buy
Strong Buy

Dashboard

1

With a Operating Losses, the company has a Weak Long Term Fundamental Strength

  • Poor long term growth as Operating profit has grown by an annual rate 13.27% of over the last 5 years
  • Company's ability to service its debt is weak with a poor EBIT to Interest (avg) ratio of -1.13
2

Flat results in Mar 26

3

Risky - Negative EBITDA

4

Below par performance in long term as well as near term

stock-summaryMojo Parameters

Mojo Parameters

Loading Valuation Snapshot...

Stock DNA

stock-summary
Industry

Media & Entertainment

stock-summary
Market cap

INR 29 Cr (Micro Cap)

stock-summary
P/E

6.00

stock-summary
Industry P/E

71

stock-summary
Dividend Yield

0.00%

stock-summary
Debt Equity

0.01

stock-summary
Return on Equity

8.18%

stock-summary
Price to Book

0.48

Revenue and Profits:
Net Sales:
2 Cr
(Quarterly Results - Mar 2026)
Net Profit:
-2 Cr
stock-summaryTotal Returns
Total Returns (Price + Dividend) stock-summary
Dividend Yield (0%)
TimePeriod
Price Return
Dividend Return
Total Return
3 Months
-10.43%
0%
-10.43%
6 Months
-20.22%
0%
-20.22%
1 Year
-33.95%
0%
-33.95%
2 Years
-72.35%
0%
-72.35%
3 Years
-45.3%
0%
-45.3%
4 Years
-52.83%
0%
-52.83%
5 Years
-51.81%
0%
-51.81%

Latest dividend: 1 per share ex-dividend date: Sep-11-2008

Risk Adjusted Returns v/s stock-summary
Returns Beta
Icon
Beta has not been calculated since enough price history is not available
stock-summaryNews & Corporate Actions

Announcements stock-summary

Compliances-Certificate under Reg. 74 (5) of SEBI (DP) Regulations 2018

10-Jul-2026 | Source : BSE

We are enclosing herewith the certificate received from MUFG Intime India Pvt. Ltd. for the quarter ended June 30 2026 certifying compliances with Reg. 74 (5) of SEBI (DP) Regulations 2018

Announcement under Regulation 30 (LODR)-Newspaper Publication

07-Jul-2026 | Source : BSE

Please find enclosed herewith intimation with regards to Newspaper Publication- Notice of Postal Ballot dated July 03 2026

Shareholder Meeting / Postal Ballot-Notice of Postal Ballot

06-Jul-2026 | Source : BSE

Notice of Postal Ballot dated July 03 2026 that was dispatched via email to all the shareholder on July 06 2026- Disclosures under Regulation 30 of SEBI (Listing obligations and Disclosure requirements) Regulations 2015

Corporate Actions stock-summary

stock-summary
BOARD MEETING

No Upcoming Board Meetings

stock-summary
DIVIDEND

Pritish Nandy Communications Ltd has declared 10% dividend, ex-date: 11 Sep 08

stock-summary
SPLITS

No Splits history available

stock-summary
BONUS

No Bonus history available

stock-summary
RIGHTS

No Rights history available

stock-summaryKey Factors

Quality key factors stock-summary

Factor
Value
Sales Growth (5y)
37.15%
EBIT Growth (5y)
13.27%
EBIT to Interest (avg)
-1.13
Debt to EBITDA (avg)
Negative Net Debt
Net Debt to Equity (avg)
0.01
Sales to Capital Employed (avg)
0.51
Tax Ratio
29.31%
Dividend Payout Ratio
0
Pledged Shares
0
Institutional Holding
0.00%
ROCE (avg)
-2.20%
ROE (avg)
2.28%

Valuation key factors

Factor
Value
P/E Ratio
6
Industry P/E
71
Price to Book Value
0.48
EV to EBIT
-29.48
EV to EBITDA
-29.48
EV to Capital Employed
0.48
EV to Sales
0.78
PEG Ratio
0.01
Dividend Yield
NA
ROCE (Latest)
-1.24%
ROE (Latest)
8.18%

Technicals key factors

Indicator
Weekly
Monthly
MACD
Mildly Bullish
Bearish
RSI
No Signal
No Signal
Bollinger Bands
Bearish
Bearish
Moving Averages
Bearish (Daily)
KST
Mildly Bullish
Mildly Bullish
Dow Theory
Mildly Bearish
No Trend
OBV
No Trend
No Trend
stock-summary Technical Indicator Scale: Bearish, Mildly Bearish, Sideways, Mildly Bullish, Bullish  Turned 
stock-summaryShareholding
Shareholding Snapshot : Jun 2026stock-summary
Shareholding Compare (%holding) stock-summary
Majority shareholders

Promoters

Pledged Promoter Holdings

None

Mutual Funds

Held by 0 Schemes

FIIs

Held by 0 FIIs

Promoter with highest holding

Ideas.com India Private Limited (21.03%)

Highest Public shareholder

Bharati Kamal Morarka (6.12%)

Individual Investors Holdings

36.05%

stock-summaryFinancial
[
  {
    "link": "quarterly",
    "btn_text": "All Quarterly Results",
    "header": "Quarterly Results Snapshot (Consolidated) - Mar'26 - YoY",
    "rhs": [
      {
        "prefix": "Net Sales ",
        "suffix": "YoY Growth in quarter ended Mar 2026 is -68.04% vs -73.02% in Mar 2025",
        "dir": 1
      },
      {
        "prefix": "Consolidated Net Profit ",
        "suffix": "YoY Growth in quarter ended Mar 2026 is -379.07% vs -138.74% in Mar 2025",
        "dir": -1
      }
    ],
    "table": {
      "header": [
        "Mar'26",
        "Mar'25",
        "Change(%)"
      ],
      "body": [
        {
          "field": "Net Sales",
          "val1": "2.49",
          "val2": "7.79",
          "chgp": "-68.04%",
          "chgp_class": "negative"
        },
        {
          "field": "Operating Profit (PBDIT) excl Other Income",
          "val1": "-2.05",
          "val2": "-0.68",
          "chgp": "-201.47%",
          "chgp_class": "negative"
        },
        {
          "field": "Interest",
          "val1": "0.04",
          "val2": "0.02",
          "chgp": "100.00%",
          "chgp_class": "negative"
        },
        {
          "field": "Exceptional Items",
          "val1": "0.00",
          "val2": "0.00",
          "chgp": "",
          "chgp_class": "neutral"
        },
        {
          "field": "Consolidate Net Profit",
          "val1": "-2.06",
          "val2": "-0.43",
          "chgp": "-379.07%",
          "chgp_class": "negative"
        },
        {
          "field": "Operating Profit Margin (Excl OI)",
          "val1": "-82.33%",
          "val2": "-8.73%",
          "chgp": "-73.60%",
          "chgp_class": "negative"
        }
      ]
    }
  },
  {
    "link": "half-yearly",
    "btn_text": "All Half Yearly Results",
    "header": "Half Yearly Results Snapshot (Consolidated) - Sep'25",
    "rhs": [
      {
        "prefix": "Net Sales ",
        "suffix": " Growth in half year ended Sep 2025 is 11.45% vs 4.02% in Sep 2024",
        "dir": 1
      },
      {
        "prefix": "Consolidated Net Profit ",
        "suffix": " Growth in half year ended Sep 2025 is -76.47% vs -121.52% in Sep 2024",
        "dir": 1
      }
    ],
    "table": {
      "header": [
        "Sep'25",
        "Sep'24",
        "Change(%)"
      ],
      "body": [
        {
          "field": "Net Sales",
          "val1": "25.40",
          "val2": "22.79",
          "chgp": "11.45%",
          "chgp_class": "positive"
        },
        {
          "field": "Operating Profit (PBDIT) excl Other Income",
          "val1": "-0.52",
          "val2": "-0.35",
          "chgp": "-48.57%",
          "chgp_class": "negative"
        },
        {
          "field": "Interest",
          "val1": "0.07",
          "val2": "0.04",
          "chgp": "75.00%",
          "chgp_class": "negative"
        },
        {
          "field": "Exceptional Items",
          "val1": "0.00",
          "val2": "0.00",
          "chgp": "",
          "chgp_class": "neutral"
        },
        {
          "field": "Consolidate Net Profit",
          "val1": "-0.30",
          "val2": "-0.17",
          "chgp": "-76.47%",
          "chgp_class": "negative"
        },
        {
          "field": "Operating Profit Margin (Excl OI)",
          "val1": "-2.05%",
          "val2": "-1.54%",
          "chgp": "-0.51%",
          "chgp_class": "negative"
        }
      ]
    }
  },
  {
    "link": "nine-monthly",
    "btn_text": "All Nine Monthly Results",
    "header": "Nine Monthly Results Snapshot (Consolidated) - Dec'25",
    "rhs": [
      {
        "prefix": "Net Sales ",
        "suffix": "YoY Growth in nine months ended Dec 2025 is 36.21% vs -10.50% in Dec 2024",
        "dir": 1
      },
      {
        "prefix": "Consolidated Net Profit ",
        "suffix": "YoY Growth in nine months ended Dec 2025 is -1,915.38% vs -139.69% in Dec 2024",
        "dir": -1
      }
    ],
    "table": {
      "header": [
        "Dec'25",
        "Dec'24",
        "Change(%)"
      ],
      "body": [
        {
          "field": "Net Sales",
          "val1": "35.17",
          "val2": "25.82",
          "chgp": "36.21%",
          "chgp_class": "positive"
        },
        {
          "field": "Operating Profit (PBDIT) excl Other Income",
          "val1": "1.62",
          "val2": "-0.97",
          "chgp": "267.01%",
          "chgp_class": "positive"
        },
        {
          "field": "Interest",
          "val1": "0.11",
          "val2": "0.06",
          "chgp": "83.33%",
          "chgp_class": "negative"
        },
        {
          "field": "Exceptional Items",
          "val1": "-17.51",
          "val2": "0.00",
          "chgp": "",
          "chgp_class": "neutral"
        },
        {
          "field": "Consolidate Net Profit",
          "val1": "-10.48",
          "val2": "-0.52",
          "chgp": "-1,915.38%",
          "chgp_class": "negative"
        },
        {
          "field": "Operating Profit Margin (Excl OI)",
          "val1": "4.61%",
          "val2": "-3.76%",
          "chgp": "8.37%",
          "chgp_class": "positive"
        }
      ]
    }
  },
  {
    "link": "annual",
    "btn_text": "All Annual Results",
    "header": "Annual Results Snapshot (Consolidated) - Mar'26",
    "rhs": [
      {
        "prefix": "Net Sales ",
        "suffix": "YoY Growth in year ended Mar 2026 is 12.08% vs -41.79% in Mar 2025",
        "dir": 1
      },
      {
        "prefix": "Consolidated Net Profit ",
        "suffix": "YoY Growth in year ended Mar 2026 is -1,220.00% vs -139.26% in Mar 2025",
        "dir": -1
      }
    ],
    "table": {
      "header": [
        "Mar'26",
        "Mar'25",
        "Change(%)"
      ],
      "body": [
        {
          "field": "Net Sales",
          "val1": "37.66",
          "val2": "33.60",
          "chgp": "12.08%",
          "chgp_class": "positive"
        },
        {
          "field": "Operating Profit (PBDIT) excl Other Income",
          "val1": "-0.43",
          "val2": "-1.68",
          "chgp": "74.40%",
          "chgp_class": "positive"
        },
        {
          "field": "Interest",
          "val1": "0.14",
          "val2": "0.08",
          "chgp": "75.00%",
          "chgp_class": "negative"
        },
        {
          "field": "Exceptional Items",
          "val1": "-17.51",
          "val2": "0.00",
          "chgp": "",
          "chgp_class": "neutral"
        },
        {
          "field": "Consolidate Net Profit",
          "val1": "-12.54",
          "val2": "-0.95",
          "chgp": "-1,220.00%",
          "chgp_class": "negative"
        },
        {
          "field": "Operating Profit Margin (Excl OI)",
          "val1": "-1.14%",
          "val2": "-5.00%",
          "chgp": "3.86%",
          "chgp_class": "positive"
        }
      ]
    }
  }
]

Quarterly Results Snapshot (Consolidated) - Mar'26 - YoYstock-summary

Mar'26
Mar'25
Change(%)
Net Sales
2.49
7.79
-68.04%
Operating Profit (PBDIT) excl Other Income
-2.05
-0.68
-201.47%
Interest
0.04
0.02
100.00%
Exceptional Items
0.00
0.00
Consolidate Net Profit
-2.06
-0.43
-379.07%
Operating Profit Margin (Excl OI)
-82.33%
-8.73%
-73.60%
Values in Rs Cr.
Direction Arrows
Net Sales

YoY Growth in quarter ended Mar 2026 is -68.04% vs -73.02% in Mar 2025

Direction Arrows
Consolidated Net Profit

YoY Growth in quarter ended Mar 2026 is -379.07% vs -138.74% in Mar 2025

Half Yearly Results Snapshot (Consolidated) - Sep'25stock-summary

Sep'25
Sep'24
Change(%)
Net Sales
25.40
22.79
11.45%
Operating Profit (PBDIT) excl Other Income
-0.52
-0.35
-48.57%
Interest
0.07
0.04
75.00%
Exceptional Items
0.00
0.00
Consolidate Net Profit
-0.30
-0.17
-76.47%
Operating Profit Margin (Excl OI)
-2.05%
-1.54%
-0.51%
Values in Rs Cr.
Direction Arrows
Net Sales

Growth in half year ended Sep 2025 is 11.45% vs 4.02% in Sep 2024

Direction Arrows
Consolidated Net Profit

Growth in half year ended Sep 2025 is -76.47% vs -121.52% in Sep 2024

Nine Monthly Results Snapshot (Consolidated) - Dec'25stock-summary

Dec'25
Dec'24
Change(%)
Net Sales
35.17
25.82
36.21%
Operating Profit (PBDIT) excl Other Income
1.62
-0.97
267.01%
Interest
0.11
0.06
83.33%
Exceptional Items
-17.51
0.00
Consolidate Net Profit
-10.48
-0.52
-1,915.38%
Operating Profit Margin (Excl OI)
4.61%
-3.76%
8.37%
Values in Rs Cr.
Direction Arrows
Net Sales

YoY Growth in nine months ended Dec 2025 is 36.21% vs -10.50% in Dec 2024

Direction Arrows
Consolidated Net Profit

YoY Growth in nine months ended Dec 2025 is -1,915.38% vs -139.69% in Dec 2024

Annual Results Snapshot (Consolidated) - Mar'26stock-summary

Mar'26
Mar'25
Change(%)
Net Sales
37.66
33.60
12.08%
Operating Profit (PBDIT) excl Other Income
-0.43
-1.68
74.40%
Interest
0.14
0.08
75.00%
Exceptional Items
-17.51
0.00
Consolidate Net Profit
-12.54
-0.95
-1,220.00%
Operating Profit Margin (Excl OI)
-1.14%
-5.00%
3.86%
Values in Rs Cr.
Direction Arrows
Net Sales

YoY Growth in year ended Mar 2026 is 12.08% vs -41.79% in Mar 2025

Direction Arrows
Consolidated Net Profit

YoY Growth in year ended Mar 2026 is -1,220.00% vs -139.26% in Mar 2025

stock-summaryCompany CV
About Pritish Nandy Communications Ltd stock-summary
stock-summary
Pritish Nandy Communications Ltd
Micro Cap
Media & Entertainment
Incorporated in September, 1993 by Pritish Nandy, author, journalist, editor and TV host, in the name of Pritish Nandy Communications Pvt Ltd was converted into a Public company from March, 2000 and was renamed as Pritish Nandy Communications Limited (PNCL). The Company is presently engaged in production and exploitation of content including cinematographic films, TV serials and Digital Series etc. for worldwide exploitation in all formats.
Company Coordinates stock-summary
Company Details
87/88 Mittal Chambers, Nariman Point Mumbai Maharashtra : 400021
stock-summary
Tel: 91-022-42130000
stock-summary
investorgrievance@pritishnandycom.c
Registrar Details
Link Intime India Pvt Ltd, C-13 Pannalal Silk Compound, L B S Marg, Bhandup , Mumbai