
Compare Priti Internati. with Similar Stocks
Total Returns (Price + Dividend) 
Latest dividend: 0.5 per share ex-dividend date: Sep-16-2021
Risk Adjusted Returns v/s
Returns Beta

News
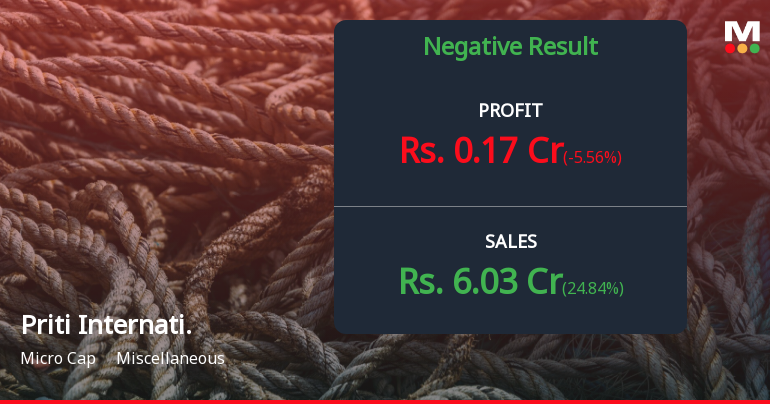
Priti International Q4 FY26: Revenue Collapse Deepens as Losses Mount
Priti International Ltd., a micro-cap handicraft manufacturer with a market capitalisation of ₹57.00 crores, reported deeply concerning Q4 FY26 results that underscore an accelerating business deterioration. The company posted net profit of just ₹0.17 crores for the March 2026 quarter, representing a marginal decline of 5.56% quarter-on-quarter and a dramatic 79.76% year-on-year collapse. More alarmingly, the company has now slipped into operating losses for the fourth consecutive quarter, with revenue plummeting 62.00% year-on-year to ₹6.03 crores.
Read full news article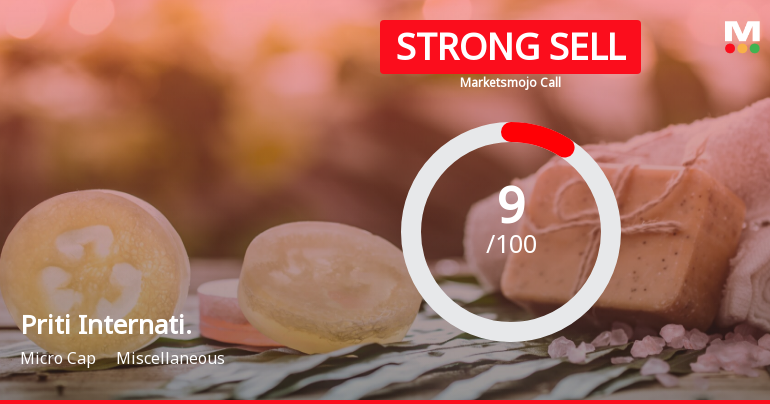
Priti International Ltd is Rated Strong Sell
Priti International Ltd is rated Strong Sell by MarketsMOJO. This rating was last updated on 14 Aug 2025, reflecting a significant reassessment of the stock’s outlook. However, the analysis and financial metrics discussed below represent the company’s current position as of 29 May 2026, providing investors with the latest insights into its performance and prospects.
Read full news article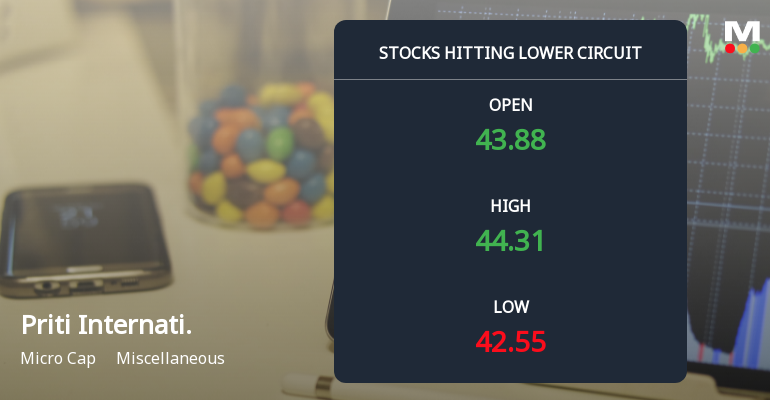
Priti International Ltd Locks at Lower Circuit With 4.98% Loss — Sellers Queue, No Buyers in Sight
At Rs 42.55, sellers were still queuing — but there were no buyers willing to take the other side. Priti International Ltd locked at its lower circuit of 4.98% on 19 May 2026, with unfilled sell orders and a frozen price.
Read full news article Announcements
Priti International Limited - Other General Purpose
18-Nov-2019 | Source : NSEPriti International Limited has informed the Exchange regarding Disclosure pursuant to Regulation under regulation 23(9) of SEBI (LODR) Regulations 2015.
Priti International Limited - Outcome of Board Meeting
14-Nov-2019 | Source : NSEPriti International Limited has informed the Exchange regarding Outcome of Board Meeting held on November 14, 2019.
Priti International Limited - Statement of deviation(s) or variation(s) under Reg. 32
22-Oct-2019 | Source : NSEPriti International Limited has informed the Exchange regarding Statement of deviation(s) or variation(s) under Reg. 32 of SEBI (LODR) Regulations 2015
Corporate Actions

No Upcoming Board Meetings

Priti International Ltd has declared 5% dividend, ex-date: 16 Sep 21

No Splits history available

Priti International Ltd has announced 3:1 bonus issue, ex-date: 20 Oct 21

No Rights history available
Quality key factors
Valuation key factors
Technicals key factors
 Technical Indicator Scale: Bearish, Mildly Bearish, Sideways, Mildly Bullish, Bullish Turned
 Shareholding Snapshot : Mar 2026
Shareholding Compare (%holding)
Promoters
None
Held by 0 Schemes
Held by 0 FIIs
Ritika Lohiya (0.22%)
Bindu Garg (1.21%)
32.37%
Quarterly Results Snapshot (Standalone) - Mar'26 - QoQ

QoQ Growth in quarter ended Mar 2026 is 24.84% vs -37.60% in Dec 2025
QoQ Growth in quarter ended Mar 2026 is -5.56% vs -37.93% in Dec 2025
Half Yearly Results Snapshot (Standalone) - Sep'25

Growth in half year ended Sep 2025 is -62.37% vs 2.83% in Sep 2024
Growth in half year ended Sep 2025 is -78.14% vs -51.95% in Sep 2024
Nine Monthly Results Snapshot (Standalone) - Dec'25
YoY Growth in nine months ended Dec 2025 is -67.79% vs 0.99% in Dec 2024
YoY Growth in nine months ended Dec 2025 is -81.63% vs -52.37% in Dec 2024
Annual Results Snapshot (Standalone) - Mar'26
YoY Growth in year ended Mar 2026 is -66.60% vs -14.69% in Mar 2025
YoY Growth in year ended Mar 2026 is -81.05% vs -50.37% in Mar 2025
About Priti International Ltd

Company Coordinates


