
 Price Point
Compare Pritika Auto with Similar Stocks
ScoreDashboard
Weak Long Term Fundamental Strength with a 17.79% CAGR growth in Operating Profits over the last 5 years
- Low ability to service debt as the company has a high Debt to EBITDA ratio of 2.73 times
- The company has been able to generate a Return on Equity (avg) of 8.42% signifying low profitability per unit of shareholders funds
Consistent Underperformance against the benchmark over the last 3 years
Mojo ParametersStock DNA

Auto Components & Equipments

INR 250 Cr (Micro Cap)

11.00
35

0.00%

0.73

8.35%

1.00
Total ReturnsTotal Returns (Price + Dividend) 
Latest dividend: 0.020000000000000004 per share ex-dividend date: Sep-20-2019
Risk Adjusted Returns v/s
Returns Beta
 News & Corporate Actions
News
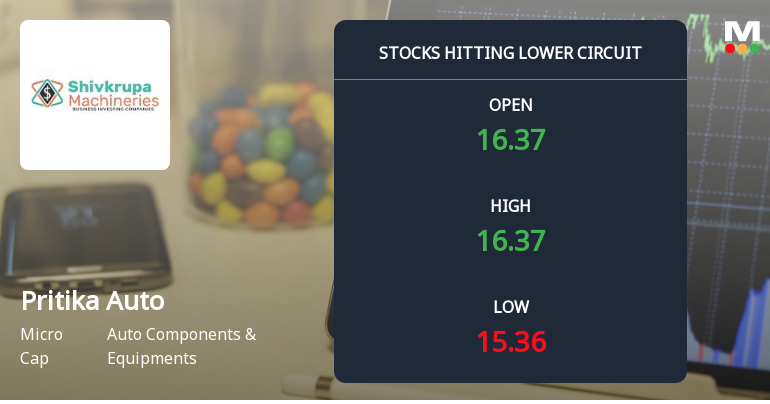
Pritika Auto Industries Ltd Locks at Lower Circuit With 4.06% Loss — Sellers Queue, No Buyers in Sight
At Rs 15.46, sellers were still queuing — but there were no buyers willing to take the other side. Pritika Auto Industries Ltd locked at its lower circuit of 4.06% on 7 Sep 2026, with unfilled sell orders and a frozen price.
Read full news article
Pritika Auto Industries Ltd is Rated Hold
Pritika Auto Industries Ltd is rated 'Hold' by MarketsMOJO, with this rating last updated on 6 August 2026. While the rating change occurred on that date, the analysis and financial metrics discussed here reflect the stock's current position as of 30 August 2026, providing investors with the most up-to-date perspective on the company’s fundamentals and market performance.
Read full news article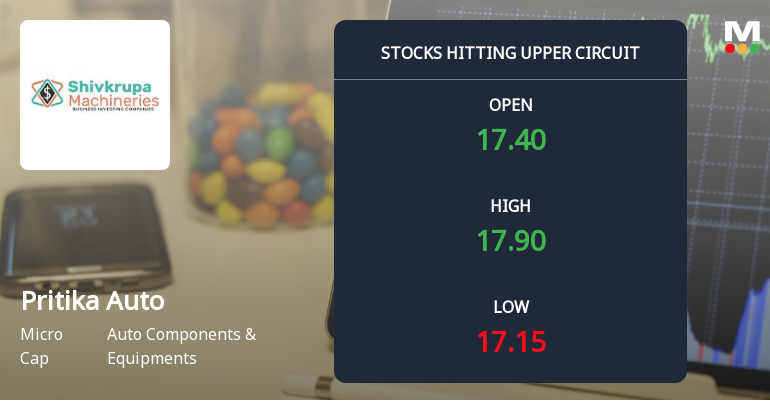
Pritika Auto Industries Ltd Locks at Upper Circuit With 5% Gain — Buyers Queue, Sellers Absent
At Rs 18.18, the buying was done — not because demand dried up, but because the exchange wouldn't let the stock go any higher. Pritika Auto Industries Ltd locked at its upper circuit of 5% on 27 Aug 2026, with buyers queuing and no sellers willing to part with shares.
Read full news article Announcements
Corporate Actions

No Upcoming Board Meetings

Pritika Auto Industries Ltd has declared 5% dividend, ex-date: 20 Sep 19

Pritika Auto Industries Ltd has announced 2:10 stock split, ex-date: 09 Apr 21

No Bonus history available

No Rights history available
Key FactorsQuality key factors
Valuation key factors
Technicals key factors
 Technical Indicator Scale: Bearish, Mildly Bearish, Sideways, Mildly Bullish, Bullish Turned Shareholding
Shareholding Snapshot : Jun 2026
Shareholding Compare (%holding)
Promoters
None
Held by 0 Schemes
Held by 1 FIIs (0.0%)
Harpreet Singh Nibber (41.78%)
Enforcement Directorate Raipur (6.61%)
31.38%
FinancialQuarterly Results Snapshot (Consolidated) - Jun'26 - QoQ
 Compare with Peers
QoQ Growth in quarter ended Jun 2026 is 4.70% vs 22.07% in Mar 2026

QoQ Growth in quarter ended Jun 2026 is 42.79% vs -16.60% in Mar 2026

Half Yearly Results Snapshot (Consolidated) - Sep'25
Growth in half year ended Sep 2025 is 32.36% vs -7.35% in Sep 2024
Growth in half year ended Sep 2025 is -19.93% vs 91.18% in Sep 2024
Nine Monthly Results Snapshot (Consolidated) - Dec'25
YoY Growth in nine months ended Dec 2025 is 34.98% vs -1.55% in Dec 2024
YoY Growth in nine months ended Dec 2025 is -4.25% vs 66.79% in Dec 2024
Annual Results Snapshot (Consolidated) - Mar'26
YoY Growth in year ended Mar 2026 is 35.32% vs 4.33% in Mar 2025
YoY Growth in year ended Mar 2026 is -5.26% vs 76.85% in Mar 2025
 Company CV
About Pritika Auto Industries Ltd

Company Coordinates










