
Compare Pro CLB with Similar Stocks
Stock DNA
Commercial Services & Supplies
INR 15 Cr (Micro Cap)
44.00
20
0.00%
0.00
3.36%
1.50
Total Returns (Price + Dividend) 
Pro CLB for the last several years.
Risk Adjusted Returns v/s
Returns Beta

News
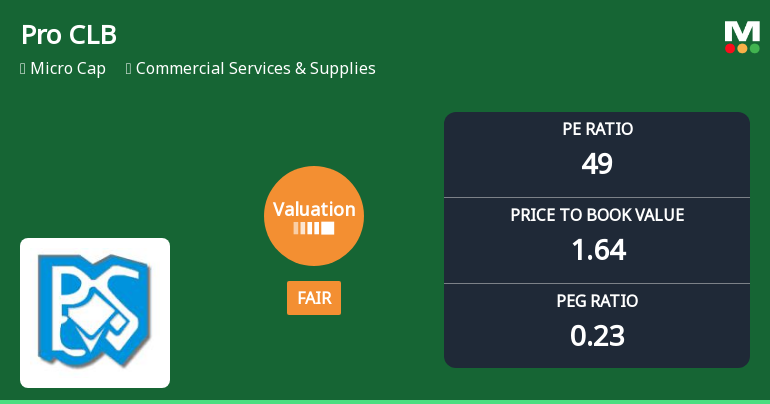
Pro CLB Global Ltd Valuation Shifts Signal Renewed Price Attractiveness
Pro CLB Global Ltd, a micro-cap player in the Commercial Services & Supplies sector, has recently undergone a notable shift in its valuation parameters, moving from a risky to a fair valuation grade. This change reflects evolving market perceptions and invites a closer examination of its price-to-earnings (P/E) and price-to-book value (P/BV) ratios relative to historical trends and peer benchmarks.
Read full news article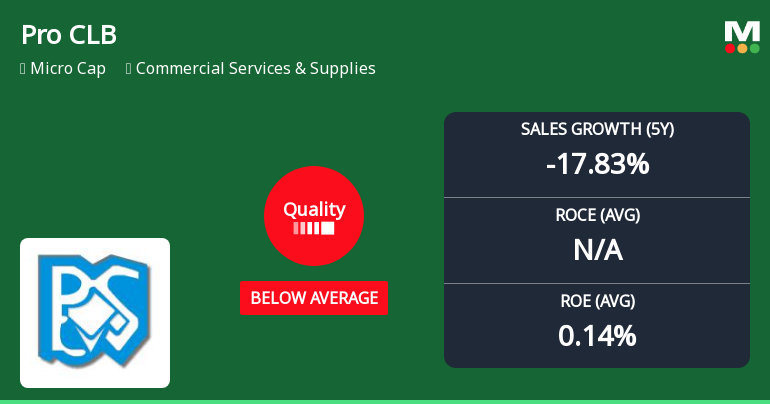
Pro CLB Global Ltd Quality Grade Downgrade Highlights Fundamental Challenges
Pro CLB Global Ltd, a micro-cap player in the Commercial Services & Supplies sector, has seen its quality grade downgraded from "Does Not Qualify" to "Below Average" as of 1 June 2026. This shift reflects deteriorating business fundamentals, including declining sales and earnings growth, subdued return ratios, and stagnant institutional interest, raising concerns about the company’s long-term value creation potential.
Read full news article Announcements
Shareholder Meeting / Postal Ballot-Notice of Postal Ballot
08-Jun-2026 | Source : BSENotice of Postal Ballot dated 5th June 2026
Board Meeting Outcome for Outcome Of The Board Meeting Held On 5Th June 2026
05-Jun-2026 | Source : BSE1. Alteration in the Object Clause of the Memorandum of Association of the Company. The details required under Regulation 30 read with Part A of Schedule III of the SEBI (LODR) Regulations 2015 read with SEBI Circular No. SEBI/HO/CFD/PoD2/CIR/P/0155 dated November 11 2024 is given in the enclosed Annexure-I. 2. Approved Notice of Postal Ballot to be sent to the shareholders of the Company and appointment of M/s. Rohit Bhatia & Associates Practicing Company Secretaries to act as Scrutinizer for the purpose of conducting the e-voting process in a fair and transparent manner. The meeting of the Board of Directors commenced at 11:45 A.M. and concluded at 12:15 P.M
Announcement under Regulation 30 (LODR)-Amendments to Memorandum & Articles of Association
05-Jun-2026 | Source : BSEAlteration of main object clause of the Memorandum of Association
Corporate Actions

No Upcoming Board Meetings

No Dividend history available

No Splits history available

No Bonus history available

No Rights history available
Quality key factors
Valuation key factors
Technicals key factors
 Technical Indicator Scale: Bearish, Mildly Bearish, Sideways, Mildly Bullish, Bullish Turned
 Shareholding Snapshot : Mar 2026
Shareholding Compare (%holding)
Non Institution
None
Held by 0 Schemes
Held by 0 FIIs
Amrit Nirmal Chamaria (0.0%)
Rajesh Poddar (5.62%)
70.78%
Quarterly Results Snapshot (Standalone) - Mar'26 - QoQ

QoQ Growth in quarter ended Mar 2026 is 159.38% vs 0.00% in Dec 2025

QoQ Growth in quarter ended Mar 2026 is 200.00% vs 242.86% in Dec 2025
Half Yearly Results Snapshot (Standalone) - Sep'25
Growth in half year ended Sep 2025 is 0.00% vs -100.00% in Sep 2024
Growth in half year ended Sep 2025 is 150.00% vs -183.33% in Sep 2024
Nine Monthly Results Snapshot (Standalone) - Dec'25
YoY Growth in nine months ended Dec 2025 is 0.00% vs -100.00% in Dec 2024
YoY Growth in nine months ended Dec 2025 is 281.25% vs -245.45% in Dec 2024
Annual Results Snapshot (Standalone) - Mar'26
YoY Growth in year ended Mar 2026 is 0.00% vs -100.00% in Mar 2025
YoY Growth in year ended Mar 2026 is 202.04% vs -644.44% in Mar 2025
About Pro CLB Global Ltd

Company Coordinates


