
Compare P&G Hygiene with Similar Stocks
Dashboard
Poor long term growth as Net Sales has grown by an annual rate of 4.63% and Operating profit at 5.40% over the last 5 years
Flat results in Mar 26
With ROE of 113.7, it has a Expensive valuation with a 38.4 Price to Book Value
Consistent Underperformance against the benchmark over the last 3 years
Total Returns (Price + Dividend) 
Latest dividend: 25.05572033898305 per share ex-dividend date: Feb-05-2026
Risk Adjusted Returns v/s
Returns Beta

News
Procter & Gamble Hygiene & Health Care Ltd. is Rated Sell
Procter & Gamble Hygiene & Health Care Ltd. is rated Sell by MarketsMOJO. This rating was last updated on 29 May 2026, reflecting a shift from a previous Hold stance. However, the analysis and financial metrics discussed here represent the stock's current position as of 11 July 2026, providing investors with the latest insights into its performance and outlook.
Read full news article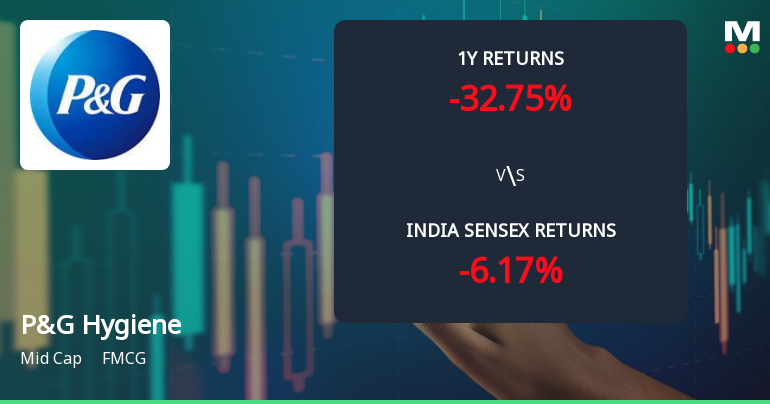
Procter & Gamble Hygiene & Health Care Ltd. Technical Momentum Shifts Amid Bearish Sentiment
Procter & Gamble Hygiene & Health Care Ltd. (P&G Hygiene), a mid-cap player in the FMCG sector, has experienced a subtle shift in its technical momentum, moving from a bearish stance to a mildly bearish outlook. Despite a modest day gain of 0.62%, the stock’s broader technical indicators reveal a complex picture of mixed signals, reflecting ongoing challenges in price momentum and market sentiment.
Read full news article
Procter & Gamble Hygiene & Health Care Ltd. is Rated Sell
Procter & Gamble Hygiene & Health Care Ltd. is rated Sell by MarketsMOJO, with this rating last updated on 29 May 2026. However, the analysis and financial metrics discussed here reflect the stock’s current position as of 30 June 2026, providing investors with the latest insights into its performance and outlook.
Read full news article Announcements
Procter & Gamble Hygiene and Health Care Limited - Shareholders meeting
28-Nov-2019 | Source : NSEProcter & Gamble Hygiene and Health Care Limited has informed the Exchange regarding Proceedings of Annual General Meeting held on November 27, 2019
Procter & Gamble Hygiene and Health Care Limited - Outcome of Board Meeting
05-Nov-2019 | Source : NSEProcter & Gamble Hygiene and Health Care Limited has informed the Exchange regarding Board meeting held on November 05, 2019.
Procter & Gamble Hygiene and Health Care Limited - Shareholders meeting
04-Nov-2019 | Source : NSEProcter & Gamble Hygiene and Health Care Limited has informed the Exchange regarding Notice of Annual General Meeting to be held on November 27, 2019
Corporate Actions

29 Jul 2026

Procter & Gamble Hygiene & Health Care Ltd. has declared 1700% dividend, ex-date: 05 Feb 26

No Splits history available

No Bonus history available

No Rights history available
Quality key factors
Valuation key factors
Technicals key factors
 Technical Indicator Scale: Bearish, Mildly Bearish, Sideways, Mildly Bullish, Bullish Turned
 Shareholding Snapshot : Mar 2026
Shareholding Compare (%holding)
Promoters
None
Held by 18 Schemes (8.65%)
Held by 101 FIIs (0.97%)
Procter And Gamble Overseas India B.v. (68.73%)
Sbi Focused Fund (5.06%)
9.8%
Quarterly Results Snapshot (Standalone) - Mar'26 - YoY

YoY Growth in quarter ended Mar 2026 is -5.20% vs -0.90% in Mar 2025
YoY Growth in quarter ended Mar 2026 is -1.90% vs 1.12% in Mar 2025
Half Yearly Results Snapshot (Standalone) - Sep'25
Not Applicable: The company has declared_date for only one period
Not Applicable: The company has declared_date for only one period
Nine Monthly Results Snapshot (Standalone) - Dec'25
YoY Growth in nine months ended Dec 2025 is 1.13% vs 1.29% in Dec 2024

YoY Growth in nine months ended Dec 2025 is 25.26% vs -5.46% in Dec 2024
Annual Results Snapshot (Standalone) - Mar'26
Not Applicable: The company has declared_date for only one period
Not Applicable: The company has declared_date for only one period
About Procter & Gamble Hygiene & Health Care Ltd.

Company Coordinates


