
Compare Profound Medical Corp. with Similar Stocks
Stock DNA
Pharmaceuticals & Biotechnology
CAD 350 Million (Small Cap)
NA (Loss Making)
NA
0.00%
-0.62
-123.00%
7.83
Total Returns (Price + Dividend) 
Profound Medical Corp. for the last several years.
Risk Adjusted Returns v/s
News
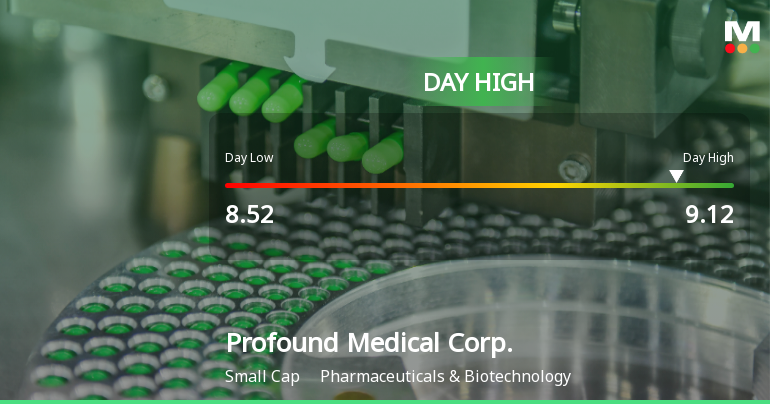
Profound Medical Corp. Hits Day High with 8.12% Surge in Stock Price
Profound Medical Corp. has seen a significant increase in its stock price today, contrasting with the modest rise of the S&P/TSX 60 index. Despite recent gains, the company faces ongoing challenges, including a substantial decline in profits over the past year and a negative return on equity.
Read full news article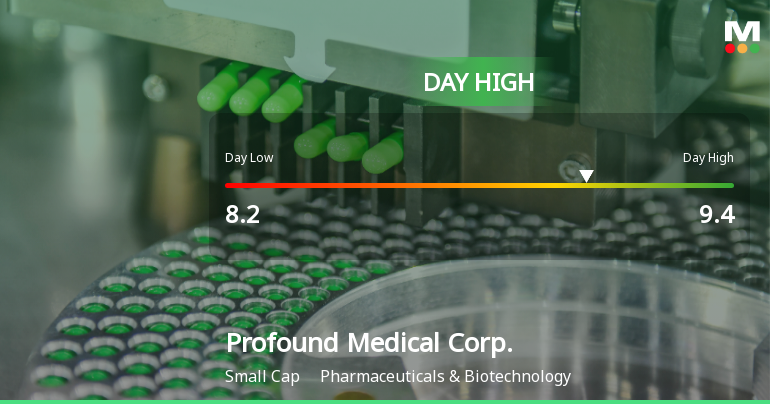
Profound Medical Corp. Hits Day High with Strong 8.12% Intraday Surge
Profound Medical Corp. has seen significant short-term gains, with an 8.12% increase on November 11, 2025, and an 8.38% rise over the past week. However, the company faces long-term challenges, including a 20.75% decline over the past year and a 63.32% drop over five years.
Read full news article Announcements

Corporate Actions
Quality key factors
Valuation key factors
Technicals key factors
 Technical Indicator Scale: Bearish, Mildly Bearish, Sideways, Mildly Bullish, Bullish Turned
 Shareholding Snapshot : Sep 2025
Shareholding Compare (%holding)
Foreign Institutions
Held in 5 Schemes (7.58%)
Held by 75 Foreign Institutions (28.38%)
Quarterly Results Snapshot (Consolidated) - Jun'25 - QoQ

QoQ Growth in quarter ended Jun 2025 is -18.42% vs -34.48% in Mar 2025
QoQ Growth in quarter ended Jun 2025 is -40.91% vs -123.19% in Mar 2025
Annual Results Snapshot (Consolidated) - Dec'24
YoY Growth in year ended Dec 2024 is 50.52% vs 11.49% in Dec 2023
YoY Growth in year ended Dec 2024 is 0.26% vs -2.41% in Dec 2023
About Profound Medical Corp.

Company Coordinates


