
Compare Prozone Realty with Similar Stocks
Dashboard
Low ability to service debt as the company has a high Debt to EBITDA ratio of 8.57 times
- Low ability to service debt as the company has a high Debt to EBITDA ratio of 8.57 times
- The company has been able to generate a Return on Equity (avg) of 1.64% signifying low profitability per unit of shareholders funds
Healthy long term growth as Net Sales has grown by an annual rate of 34.20% and Operating profit at 46.82%
Flat results in Mar 26
With ROCE of 5.2, it has a Expensive valuation with a 1.3 Enterprise value to Capital Employed
Despite the size of the company, domestic mutual funds hold only 0% of the company
Total Returns (Price + Dividend) 
Prozone Realty for the last several years.
Risk Adjusted Returns v/s
Returns Beta

News

Prozone Realty Ltd is Rated Hold
Prozone Realty Ltd is rated 'Hold' by MarketsMOJO, with this rating last updated on 30 May 2026. While the rating change occurred on that date, the analysis and financial metrics discussed here reflect the company’s current position as of 09 June 2026, providing investors with the most up-to-date insight into the stock’s fundamentals, valuation, financial trends, and technical outlook.
Read full news article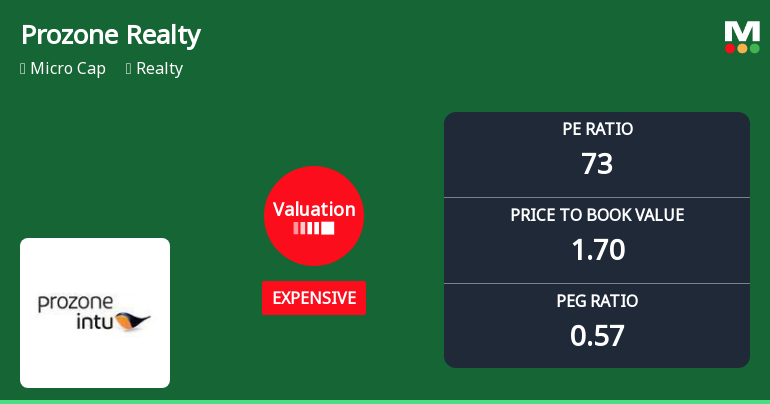
Prozone Realty Ltd Valuation Shifts Amid Mixed Market Returns
Prozone Realty Ltd has experienced a notable shift in its valuation parameters, moving from a 'very expensive' to an 'expensive' rating, reflecting evolving market perceptions and price attractiveness. Despite a slight dip in share price, the company’s valuation metrics and comparative performance against peers and benchmarks provide a nuanced picture for investors assessing its future potential.
Read full news article
Prozone Realty Ltd Valuation Shifts: Price Attractiveness and Market Context Analysis
Prozone Realty Ltd has experienced a notable shift in its valuation parameters, moving from a very expensive to an expensive rating, reflecting a subtle change in price attractiveness. Despite a recent day decline of 3.47%, the company’s valuation metrics and comparative performance against peers and the broader market offer a nuanced perspective for investors navigating the realty sector.
Read full news article Announcements
Shareholder Meeting / Postal Ballot-Outcome of Postal_Ballot
02-Jun-2026 | Source : BSEDear Sir/ Madam Please find attached Revised Postal Ballot Outcome.
Announcement under Regulation 30 (LODR)-Diversification / Disinvestment
02-Jun-2026 | Source : BSEDear Sir/ Madam Shareholders of the Company approved disinvestment / sale of stake held in Material Subsidiary (ies) / step-down material subsidiary ies) of the Company and Hiving Off of identified assets of selected subsidiaries.
Shareholder Meeting / Postal Ballot-Outcome of Postal_Ballot
01-Jun-2026 | Source : BSEDear Sir/ Madam Shareholders of the Company approved disinvestment / sale of stake held in Material Subsidiary (ies) / step-down material subsidiary ies) of the Company and Hiving Off of identified assets of selected subsidiaries.
Corporate Actions

No Upcoming Board Meetings

No Dividend history available

No Splits history available

No Bonus history available

No Rights history available
Quality key factors
Valuation key factors
Technicals key factors
 Technical Indicator Scale: Bearish, Mildly Bearish, Sideways, Mildly Bullish, Bullish Turned
 Shareholding Snapshot : Mar 2026
Shareholding Compare (%holding)
Promoters
None
Held by 0 Schemes
Held by 7 FIIs (3.05%)
Apax Trust (31.17%)
Saraswati Commercial (india) Ltd (4.64%)
25.21%
Quarterly Results Snapshot (Consolidated) - Mar'26 - QoQ

QoQ Growth in quarter ended Mar 2026 is -9.72% vs 26.07% in Dec 2025

QoQ Growth in quarter ended Mar 2026 is 272.07% vs 17.76% in Dec 2025
Half Yearly Results Snapshot (Consolidated) - Sep'25
Growth in half year ended Sep 2025 is 4.16% vs -11.48% in Sep 2024
Growth in half year ended Sep 2025 is 138.07% vs -157.38% in Sep 2024
Nine Monthly Results Snapshot (Consolidated) - Dec'25
YoY Growth in nine months ended Dec 2025 is 13.30% vs -5.30% in Dec 2024
YoY Growth in nine months ended Dec 2025 is 179.06% vs -152.14% in Dec 2024
Annual Results Snapshot (Consolidated) - Mar'26
YoY Growth in year ended Mar 2026 is 9.23% vs -3.13% in Mar 2025
YoY Growth in year ended Mar 2026 is 128.18% vs -937.31% in Mar 2025
About Prozone Realty Ltd

Company Coordinates


