
Compare Prudent Corp with Similar Stocks
Dashboard
Strong Long Term Fundamental Strength with an average Return on Equity (ROE) of 30.07%
Healthy long term growth as Operating profit has grown by an annual rate of 30.58%
The company has declared Positive results for the last 16 consecutive quarters
High Institutional Holdings at 38.23%
Consistent Returns over the last 3 years
Stock DNA
Capital Markets
INR 13,416 Cr (Small Cap)
54.00
21
0.11%
0.04
25.16%
15.12
Total Returns (Price + Dividend) 
Latest dividend: 3.491484919594175 per share ex-dividend date: Jul-17-2026
Risk Adjusted Returns v/s
Returns Beta

News
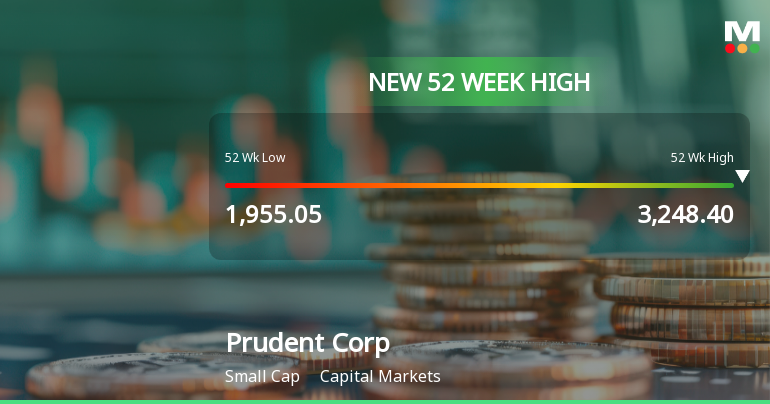
Broad-Based Technical Strength Lifts Prudent Corporate Advisory Services Ltd to 52-Week High of Rs 3276.55
Surging to a new 52-week high of Rs 3,276.55 on 31 Jul 2026, Prudent Corporate Advisory Services Ltd has demonstrated robust momentum, extending gains for five consecutive sessions and delivering a 14% return in this period. This rally unfolds amid a broadly positive market backdrop, with the Sensex inching higher and key indices like the S&P BSE MidCap Select and NIFTY NEXT 50 also marking fresh highs.
Read full news article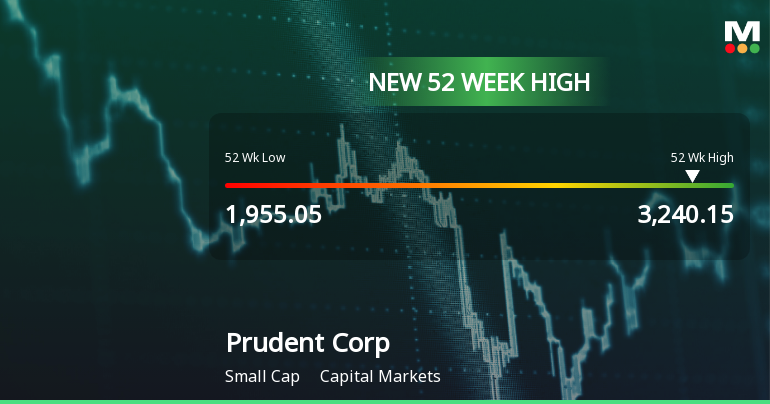
Broad-Based Technical Strength Lifts Prudent Corporate Advisory Services Ltd to 52-Week High of Rs 3240.15
With a decisive surge to Rs 3240.15 on 29 Jul 2026, Prudent Corporate Advisory Services Ltd has reached a fresh 52-week high, marking a notable milestone in its price momentum. This rally is underpinned by a confluence of bullish technical indicators and sustained upward price action over recent sessions.
Read full news article
Prudent Corporate Advisory Services Ltd Sees Bullish Momentum Amid Technical Upgrades
Prudent Corporate Advisory Services Ltd has demonstrated a marked shift in price momentum, supported by a suite of bullish technical indicators. The stock’s recent 7.88% surge to ₹3,095.90, nearing its 52-week high of ₹3,158.85, signals renewed investor confidence amid a broader capital markets backdrop that remains challenging. This article analyses the technical parameters driving this momentum and contextualises the stock’s performance against key benchmarks.
Read full news article Announcements
Announcement under Regulation 30 (LODR)-Analyst / Investor Meet - Outcome
27-Jul-2026 | Source : BSEAudio Recording of Q1FY2027 Results Conference call
Announcement under Regulation 30 (LODR)-Newspaper Publication
27-Jul-2026 | Source : BSENewspaper Publication
Board Meeting Outcome for Board Meeting Outcome For Outcome Of Board Meeting Held On 25Th July 2026
25-Jul-2026 | Source : BSEOutcome of Board Meeting held on 25th July 2026.
Corporate Actions

No Upcoming Board Meetings

Prudent Corporate Advisory Services Ltd has declared 70% dividend, ex-date: 17 Jul 26

No Splits history available

No Bonus history available

No Rights history available
Quality key factors
Valuation key factors
Technicals key factors
 Technical Indicator Scale: Bearish, Mildly Bearish, Sideways, Mildly Bullish, Bullish Turned
 Shareholding Snapshot : Jun 2026
Shareholding Compare (%holding)
Promoters
None
Held by 22 Schemes (21.88%)
Held by 99 FIIs (14.29%)
Sanjay Rameshchandra Shah (41.96%)
Zulia Investments Pte. Ltd. (6.69%)
3.33%
Quarterly Results Snapshot (Consolidated) - Jun'26 - QoQ

QoQ Growth in quarter ended Jun 2026 is -3.59% vs 5.07% in Mar 2026

QoQ Growth in quarter ended Jun 2026 is 26.48% vs 2.57% in Mar 2026
Half Yearly Results Snapshot (Consolidated) - Sep'25
Growth in half year ended Sep 2025 is 14.58% vs 50.65% in Sep 2024
Growth in half year ended Sep 2025 is 10.03% vs 63.68% in Sep 2024
Nine Monthly Results Snapshot (Consolidated) - Dec'25
YoY Growth in nine months ended Dec 2025 is 16.60% vs 45.13% in Dec 2024
YoY Growth in nine months ended Dec 2025 is 13.23% vs 52.80% in Dec 2024
Annual Results Snapshot (Consolidated) - Mar'26
YoY Growth in year ended Mar 2026 is 19.37% vs 37.07% in Mar 2025
YoY Growth in year ended Mar 2026 is 13.49% vs 41.01% in Mar 2025
About Prudent Corporate Advisory Services Ltd

Company Coordinates


