
Compare PSP Projects with Similar Stocks
Stock DNA
Construction
INR 4,056 Cr (Small Cap)
73.00
24
0.00%
-0.07
4.39%
3.19
Total Returns (Price + Dividend) 
Latest dividend: 2.5155298603850174 per share ex-dividend date: Sep-01-2023
Risk Adjusted Returns v/s
Returns Beta

News

PSP Projects Ltd is Rated Buy by MarketsMOJO
PSP Projects Ltd is rated Buy by MarketsMOJO, with this rating last updated on 19 June 2026. However, the analysis and financial metrics discussed here reflect the company’s current position as of 25 July 2026, providing investors with the most up-to-date insight into the stock’s fundamentals, returns, and technical outlook.
Read full news article
PSP Projects Ltd is Rated Buy by MarketsMOJO
PSP Projects Ltd is rated Buy by MarketsMOJO, with this rating last updated on 19 June 2026. However, the analysis and financial metrics discussed here reflect the company’s current position as of 14 July 2026, providing investors with the most up-to-date view of the stock’s fundamentals, returns, and technical outlook.
Read full news article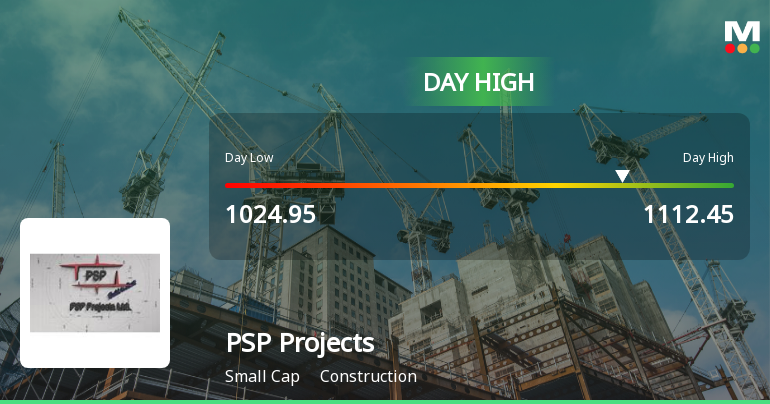
PSP Projects Ltd Surges 8.09% to Day's High of Rs 1110.25 — Outperforms Sector by 6.65 Percentage Points
The Sensex advanced 0.72% on 6 Jul 2026, yet PSP Projects Ltd outpaced the broader market with an 8.09% gain, touching a fresh 52-week and all-time high of Rs 1110.25. This 6.65 percentage-point outperformance over its construction sector peers highlights a distinctly stock-specific rally rather than a mere market tailwind.
Read full news article Announcements
Announcement under Regulation 30 (LODR)-Newspaper Publication
21-Jul-2026 | Source : BSESubmission of Newspaper Publication for transfer of shares to IEPF
Disclosure Under Regulation 30 Of The SEBI (Listing Obligations And Disclosure Requirements) Regulations 2015 (SEBI Listing Regulations) - ESG Rating
11-Jul-2026 | Source : BSEIntimation of ESG Ratings
Announcement under Regulation 30 (LODR)-Analyst / Investor Meet - Intimation
09-Jul-2026 | Source : BSEIntimation of Q1FY27 Earnings Conference Call
Corporate Actions

30 Jul 2026

PSP Projects Ltd has declared 25% dividend, ex-date: 01 Sep 23

No Splits history available

No Bonus history available

No Rights history available
Quality key factors
Valuation key factors
Technicals key factors
 Technical Indicator Scale: Bearish, Mildly Bearish, Sideways, Mildly Bullish, Bullish Turned
 Shareholding Snapshot : Jun 2026
Shareholding Compare (%holding)
Promoters
None
Held by 5 Schemes (2.53%)
Held by 43 FIIs (2.1%)
Adani Infra (india) Limited (34.41%)
Madhulika Agarwal (2.27%)
17.06%
Quarterly Results Snapshot (Consolidated) - Mar'26 - YoY

YoY Growth in quarter ended Mar 2026 is 65.74% vs 0.77% in Mar 2025
YoY Growth in quarter ended Mar 2026 is 226.47% vs -58.38% in Mar 2025
Half Yearly Results Snapshot (Consolidated) - Sep'25

Growth in half year ended Sep 2025 is 0.96% vs 6.68% in Sep 2024
Growth in half year ended Sep 2025 is -63.05% vs -41.21% in Sep 2024
Nine Monthly Results Snapshot (Consolidated) - Dec'25
YoY Growth in nine months ended Dec 2025 is 10.56% vs 0.07% in Dec 2024
YoY Growth in nine months ended Dec 2025 is -31.09% vs -53.51% in Dec 2024
Annual Results Snapshot (Consolidated) - Mar'26
YoY Growth in year ended Mar 2026 is 25.34% vs 0.25% in Mar 2025
YoY Growth in year ended Mar 2026 is -1.60% vs -54.12% in Mar 2025
About PSP Projects Ltd

Company Coordinates


