
Compare PTL Enterprises with Similar Stocks
Dashboard
Company has a Debt to Equity ratio (avg) of 0.02 times
Poor long term growth as Net Sales has grown by an annual rate of 0.35% and Operating profit at 0.23% over the last 5 years
Positive results in Mar 26
With ROE of 5.5, it has a Very Expensive valuation with a 0.6 Price to Book Value
Despite the size of the company, domestic mutual funds hold only 0% of the company
Consistent Underperformance against the benchmark over the last 3 years
Stock DNA
Diversified Commercial Services
INR 535 Cr (Micro Cap)
12.00
19
8.13%
0.00
5.48%
0.63
Total Returns (Price + Dividend) 
Latest dividend: 1.5 per share ex-dividend date: Feb-10-2026
Risk Adjusted Returns v/s
Returns Beta

News

PTL Enterprises Ltd Technical Momentum Shifts Amid Mixed Market Signals
PTL Enterprises Ltd, a micro-cap player in the diversified commercial services sector, has experienced a subtle shift in its technical momentum, moving from a sideways trend to a mildly bearish stance. Despite a modest decline in its share price to ₹40.00, the stock’s technical indicators present a complex picture, with bullish signals on some weekly charts contrasting with bearish cues on monthly timeframes. This nuanced technical landscape warrants a detailed analysis for investors seeking clarity on PTL’s near-term prospects.
Read full news article
PTL Enterprises Ltd is Rated Sell
PTL Enterprises Ltd is rated 'Sell' by MarketsMOJO, with this rating last updated on 18 May 2026. However, the analysis and financial metrics discussed here reflect the stock’s current position as of 10 June 2026, providing investors with the most up-to-date view of the company’s fundamentals, returns, and market standing.
Read full news article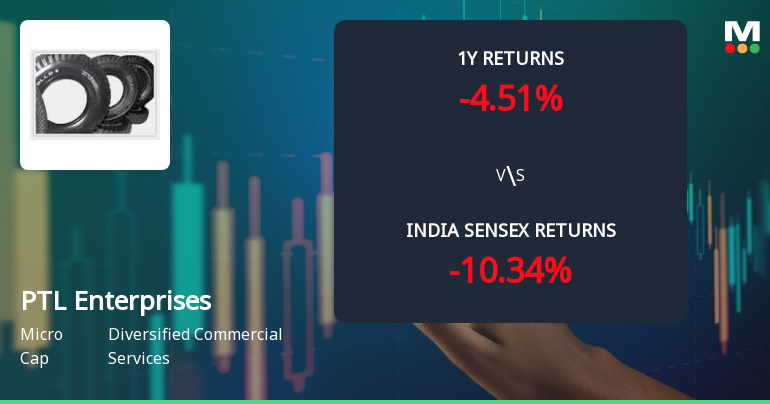
PTL Enterprises Ltd Technical Momentum Shifts Amid Mixed Market Signals
PTL Enterprises Ltd, a micro-cap player in the Diversified Commercial Services sector, has experienced a notable shift in its technical momentum, moving from a mildly bearish stance to a sideways trend. Despite a modest day gain of 1.64%, the stock’s technical indicators present a complex picture, with bullish signals on weekly MACD and Bollinger Bands contrasting with mildly bearish daily moving averages and a recent downgrade in its Mojo Grade to Sell.
Read full news article Announcements
Announcement under Regulation 30 (LODR)-Newspaper Publication
03-Jun-2026 | Source : BSEIntimation of newspaper publication
Announcement under Regulation 30 (LODR)-Newspaper Publication
23-May-2026 | Source : BSENewspaper Publication for opening of the special window for transfer and dematerialisation of physical securities
Announcement under Regulation 30 (LODR)-Newspaper Publication
15-May-2026 | Source : BSEIntimation of newspaper for publication of financials results for quarter and year ended 30th March 2026
Corporate Actions

No Upcoming Board Meetings

PTL Enterprises Ltd has declared 150% dividend, ex-date: 10 Feb 26

PTL Enterprises Ltd has announced 1:2 stock split, ex-date: 23 Dec 21

No Bonus history available

No Rights history available
Quality key factors
Valuation key factors
Technicals key factors
 Technical Indicator Scale: Bearish, Mildly Bearish, Sideways, Mildly Bullish, Bullish Turned
 Shareholding Snapshot : Mar 2026
Shareholding Compare (%holding)
Promoters
None
Held by 0 Schemes
Held by 1 FIIs (0.0%)
Sunrays Properties And Investments Company Private Limited (69.82%)
Governor Of Kerala (5.1%)
16.1%
Quarterly Results Snapshot (Standalone) - Mar'26 - QoQ

QoQ Growth in quarter ended Mar 2026 is -0.12% vs 0.00% in Dec 2025

QoQ Growth in quarter ended Mar 2026 is 48.26% vs -39.58% in Dec 2025
Half Yearly Results Snapshot (Standalone) - Sep'25
Growth in half year ended Sep 2025 is 0.00% vs 0.00% in Sep 2024
Growth in half year ended Sep 2025 is 25.39% vs 50.71% in Sep 2024
Nine Monthly Results Snapshot (Standalone) - Dec'25
YoY Growth in nine months ended Dec 2025 is 0.00% vs 0.00% in Dec 2024
YoY Growth in nine months ended Dec 2025 is 19.57% vs 53.09% in Dec 2024
Annual Results Snapshot (Standalone) - Mar'26
YoY Growth in year ended Mar 2026 is 0.00% vs -0.02% in Mar 2025
YoY Growth in year ended Mar 2026 is 27.19% vs 54.07% in Mar 2025
About PTL Enterprises Ltd

Company Coordinates


