Punjab Chemicals

  • Market Cap: Micro Cap
  • Industry: Pesticides & Agrochemicals
  • ISIN: INE277B01014
  • NSEID: PUNJABCHEM
  • BSEID: 506618
INR
1,157.35
-5.45 (-0.47%)
BSENSE

Jul 17, 03:30 PM

BSE+NSE Vol: 11.22 k

  • Price Points
  • Score
  • Mojo Parameters
  • Total Return
  • News and Corporate Actions
  • Key factors
  • Shareholding
  • Financials
  • CompanyCV
stock-recommendationUpcoming Result: Punjab Chemicals will declare its result soon on 31 Jul 2026
stock-summaryPrice Point
High/Low

1Day

52 Week

Valuation
Technical
Day's Volume

CASH

11.22 k (-61.94%) Volume

Shareholding (Jun 2026)

FII

5.86%

Held by 8 FIIs

DII

0.64%

Held by 0 DIIs

Promoter

39.24%

Why is Punjab Chemicals & Crop Protection Ltd falling/rising?

19-Jul-2026

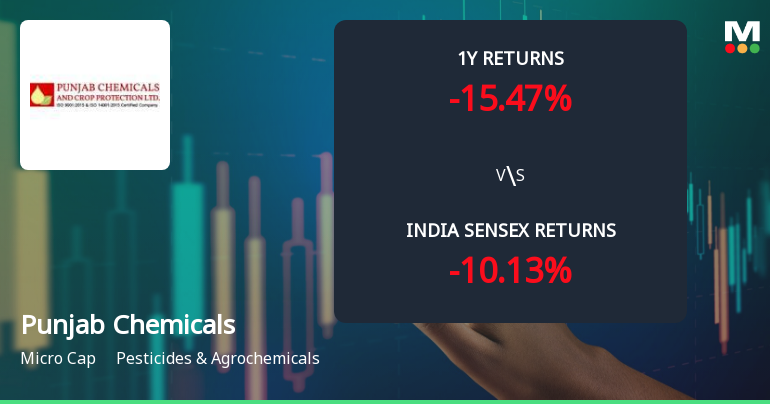
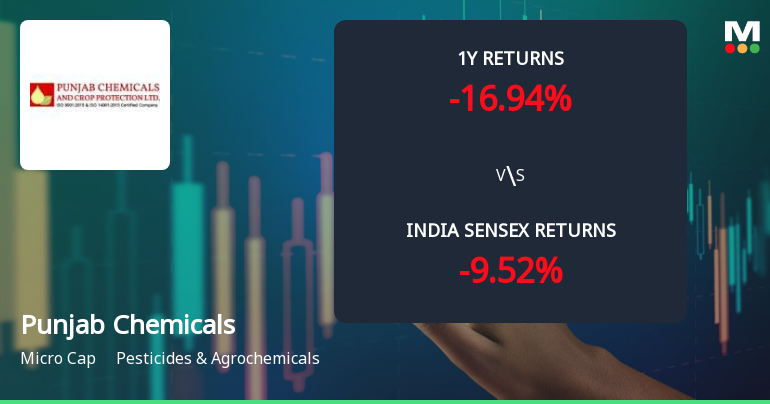
As of 18-Jul, the stock price of Punjab Chemicals & Crop Protection Ltd is 1,157.35, down 0.47%. Despite recent positive returns over the week and month, the stock has declined 5.07% year-to-date and 13.73% over the past year, with a significant drop in delivery volume indicating potential investor concerns.

As of 18-Jul, the stock price of Punjab Chemicals & Crop Protection Ltd is currently at 1,157.35, reflecting a decrease of 5.45 points or 0.47%. Despite this decline, the stock has shown positive performance over the past week and month, with returns of 4.99% and 14.09%, respectively, outperforming the Sensex during these periods. However, the year-to-date performance indicates a decline of 5.07%, which is less favorable compared to the Sensex's drop of 8.30%. Over the past year, the stock has decreased by 13.73%, while the Sensex has only fallen by 4.99%.<BR><BR>Today's trading activity shows that the stock touched an intraday low of Rs 1,129.95, which represents a decrease of 2.83%. Additionally, the stock is currently trading above its 5-day, 20-day, 50-day, 100-day, and 200-day moving averages, indicating a generally positive trend in the short to medium term. However, there is a notable decline in investor participation, with delivery volume dropping by 66.64% compared to the 5-day average, which may contribute to the stock's current price decline. Overall, while the stock has had some positive movements recently, the significant drop in delivery volume and the current price decrease suggest that there are underlying concerns affecting investor confidence.

View full answer

How big is Punjab Chemicals?

11-Jun-2026

As of 10th June, Punjab Chemicals & Crop Protection Ltd has a market capitalization of 1,179.00 Cr, with recent net sales of 1,029.80 Cr and a net profit of 63.96 Cr.

As of 10th June, Punjab Chemicals & Crop Protection Ltd has a market capitalization of 1,179.00 Cr, categorizing it as a Micro Cap company.<BR><BR>In the latest four quarters, the company reported Net Sales of 1,029.80 Cr and a Net Profit of 63.96 Cr.<BR><BR>The latest annual period for the balance sheet is March 2025, with Shareholder's Funds amounting to 364.71 Cr and Total Assets of 800.60 Cr.

View full answer

Who are in the management team of Punjab Chemicals?

11-Jun-2026

The management team of Punjab Chemicals includes G Narayana (Chairman Emeritus), Mukesh D Patel (Chairman & Independent Director), Shalil Shroff (Managing Director), and several other directors and officers, bringing diverse expertise to the company.

The management team of Punjab Chemicals includes the following members:<BR><BR>1. G Narayana - Chairman Emeritus<BR>2. Vijay Rai - Non-Executive & Independent Director<BR>3. Shivshankar S Tiwari - Non-Executive & Non-Independent Director<BR>4. Mukesh D Patel - Chairman & Independent Director<BR>5. S S Chopra - Non-Executive & Non-Independent Director<BR>6. Shalil Shroff - Managing Director<BR>7. Avtar Singh - Director (Business Development)<BR>8. Sheo Prasad Singh - Non-Executive & Independent Director<BR>9. Aruna R Bhinge - Non-Executive & Independent Director<BR>10. Rishu Chatley - Company Secretary & Compliance Officer<BR><BR>This team brings a diverse range of expertise and leadership to the company.

View full answer

Who are the peers of the Punjab Chemicals?

11-Jun-2026

Punjab Chemicals' peers include Insecticid.India, India Pesticides, Astec Lifescienc, Meghmani Organi, Dharmaj Crop, Heranba Inds, and Best Agrolife. In terms of management risk, growth, and capital structure, Insecticid.India and India Pesticides perform best, while Meghmani Organi shows the lowest returns.

Peers: The peers of Punjab Chemicals are Insecticid.India, India Pesticides, Astec Lifescienc, Meghmani Organi., Dharmaj Crop, Heranba Inds, and Best Agrolife.<BR><BR>Quality Snapshot: Excellent management risk is observed at Insecticid.India and India Pesticides, while Average management risk is found at Punjab Chemicals, Dharmaj Crop, Heranba Inds, and the rest. Below Average management risk is noted at Astec Lifescienc and Meghmani Organi. Growth is rated as Good for Dharmaj Crop, Below Average for Insecticid.India, India Pesticides, Punjab Chemicals, Astec Lifescienc, Heranba Inds, Best Agrolife, and the rest, while Meghmani Organi. shows Below Average growth. Capital Structure is rated as Excellent for Insecticid.India and India Pesticides, Good for Punjab Chemicals, Average for Meghmani Organi., and Below Average for Astec Lifescienc, while Excellent is noted for Dharmaj Crop and Average for Heranba Inds and Best Agrolife.<BR><BR>Return Snapshot: The peer with the highest 1-year return is Dharmaj Crop at 0.44%, while the lowest is Meghmani Organi. at -48.86%. Punjab Chemicals has a 1-year return of -7.69%, which is better than Meghmani Organi. but worse than Dharmaj Crop. Additionally, peers such as Meghmani Organi., Heranba Inds, and Best Agrolife have negative six-month returns.

View full answer

What does Punjab Chemicals do?

10-Jun-2026

Punjab Chemicals & Crop Protection Ltd manufactures agro chemicals, specialty chemicals, and bulk drugs, with a market cap of INR 1,179 Cr. As of March 2026, it reported net sales of 209 Cr and a net profit of 11 Cr.

Overview: <BR>Punjab Chemicals & Crop Protection Ltd is engaged in the manufacturing of agro chemicals, specialty chemicals, and bulk drugs, operating within the Pesticides & Agrochemicals industry and categorized as a Micro Cap company.<BR><BR>History: <BR>Incorporated in 1975, Punjab Chemicals & Pharmaceuticals Limited (PCAPL) commenced commercial production in October 1978. The latest quarterly results reported net sales and profit for March 2026.<BR><BR>Financial Snapshot: <BR>Most recent Net Sales: 209 Cr (Quarterly Results - Mar 2026) <BR>Most recent Net Profit: 11 Cr (Quarterly Results - Mar 2026) <BR>Market-cap value: INR 1,179 Cr (Micro Cap)<BR><BR>Key Metrics: <BR>P/E: 19.00 <BR>Industry P/E: 29 <BR>Dividend Yield: 0.32% <BR>Debt-Equity: 0.33 <BR>Return on Equity: 15.47% <BR>Price to Book: 2.75<BR><BR>Contact Details: <BR>Address: Milestone 18 Ambala Kalka Road, Vill PO Bhankharpur Derabassi Mohali Punjab : 140201 <BR>Tel: 91-1762-280086/280094 <BR>Email: info@punjabchemicals.com <BR>Website: http://www.punjabchemicals.com

View full answer

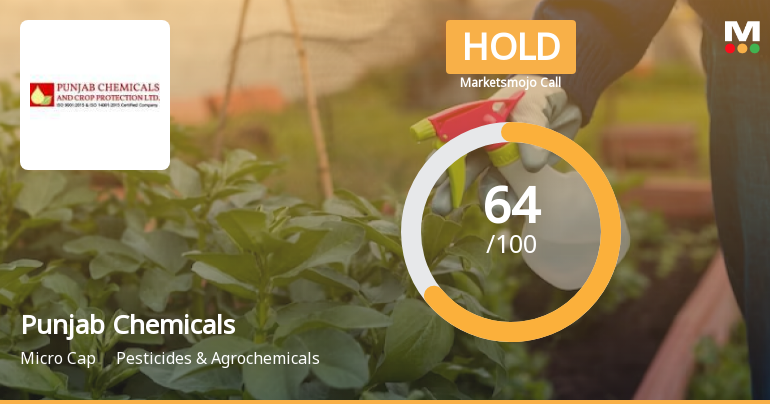
Should I buy, sell or hold Punjab Chemicals & Crop Protection Ltd?

02-May-2026

Are Punjab Chemicals & Crop Protection Ltd latest results good or bad?

28-Jan-2026

Punjab Chemicals & Crop Protection Ltd's latest results show strong year-on-year growth with a 5.38% revenue increase and a 49.88% rise in net profit, but quarterly performance is concerning with a 20.14% sales decline and a 10.13% drop in net profit. Investors should be cautious due to these mixed signals and pressures on profitability.

Punjab Chemicals & Crop Protection Ltd's latest results present a mixed picture. On one hand, the company reported a year-on-year revenue growth of 5.38%, with net profit increasing by an impressive 49.88% compared to the same quarter last year, reaching ₹18.54 crores. This indicates strong annual performance and operational resilience.<BR><BR>However, the quarterly performance shows significant challenges. There was a notable decline in sales of 20.14% quarter-on-quarter, dropping to ₹255.16 crores, and net profit also fell by 10.13% compared to the previous quarter. The operating margin has contracted slightly to 10.28%, suggesting pressures on profitability.<BR><BR>Additionally, the unusually low effective tax rate of 15.30% in this quarter, down from 25.28% previously, raises concerns about the sustainability of earnings quality moving forward. Overall, while the annual growth figures are encouraging, the sequential declines and margin pressures indicate that the company is facing challenging market conditions, particularly in the agrochemicals sector.<BR><BR>Investors should approach the results with caution, considering both the strong year-on-year performance and the recent quarterly declines.

View full answer

Is Punjab Chemicals overvalued or undervalued?

03-Dec-2025

As of December 2, 2025, Punjab Chemicals is fairly valued with a PE ratio of 31.00 and a favorable PEG ratio of 0.78, outperforming the Sensex with a 34.19% return, while being competitively positioned against peers like UPL and P I Industries.

As of 2 December 2025, the valuation grade for Punjab Chemicals has moved from expensive to fair, indicating a more favorable assessment of its market position. The company is currently fairly valued. Key ratios include a PE ratio of 31.00, an EV to EBITDA of 17.12, and a PEG ratio of 0.78, which suggests that the stock is reasonably priced relative to its growth potential.<BR><BR>In comparison to its peers, UPL is rated attractive with a PE of 26.47, while P I Industries is deemed very expensive with a PE of 33.96. This positions Punjab Chemicals competitively within the industry, particularly given its favorable PEG ratio compared to P I Industries. Notably, Punjab Chemicals has outperformed the Sensex over the past year with a return of 34.19% versus the Sensex's 6.09%, reinforcing its valuation outlook.

View full answer

Is Punjab Chemicals technically bullish or bearish?

28-Nov-2025

As of November 27, 2025, Punjab Chemicals shows a bullish trend supported by daily moving averages and monthly KST signals, though caution is advised due to a mildly bearish weekly MACD.

As of 27 November 2025, the technical trend has changed from mildly bullish to bullish. The current technical stance is bullish with moderate strength. Key indicators driving this stance include a bullish signal from the daily moving averages and a bullish outlook from the monthly KST. The Bollinger Bands are also indicating a bullish trend on the weekly timeframe. However, the weekly MACD remains mildly bearish, which suggests some caution. Overall, the combination of these indicators supports a bullish sentiment for Punjab Chemicals in the current market environment.

View full answer

How has been the historical performance of Punjab Chemicals?

03-Nov-2025

Punjab Chemicals has shown fluctuating historical performance, with declining net sales and profits from March 2023 to March 2025, despite an increase in total assets and liabilities. Operating profit decreased, reflecting challenges in profitability, while cash flow from operations also declined.

Answer:<BR>The historical performance of Punjab Chemicals shows a fluctuating trend in key financial metrics over the years.<BR><BR>Breakdown:<BR>Punjab Chemicals' net sales have seen a decline from INR 1,006.21 crore in March 2023 to INR 900.52 crore in March 2025, with a peak in March 2023. The total operating income followed a similar trend, decreasing from INR 1,006.21 crore in March 2023 to INR 900.52 crore in March 2025. The total expenditure, excluding depreciation, also decreased from INR 883.64 crore in March 2023 to INR 801.33 crore in March 2025. Operating profit (PBDIT) has declined from INR 125.92 crore in March 2023 to INR 100.62 crore in March 2025, reflecting a decrease in operating profit margin from 12.18% to 11.01%. Profit before tax decreased from INR 88.88 crore in March 2023 to INR 53.57 crore in March 2025, leading to a reduction in profit after tax from INR 61.10 crore to INR 38.93 crore over the same period. The company's total assets increased from INR 616.00 crore in March 2023 to INR 800.60 crore in March 2025, while total liabilities also rose from INR 616.00 crore to INR 800.60 crore. Cash flow from operating activities showed a decline from INR 58.00 crore in March 2023 to INR 25.00 crore in March 2025, although the net cash inflow improved from an outflow of INR 2.00 crore in March 2024 to an inflow of INR 6.00 crore in March 2025. Overall, Punjab Chemicals has experienced a mixed performance with both challenges in profitability and growth in total assets and liabilities.

View full answer

Who are the top shareholders of the Punjab Chemicals?

17-Jul-2025

The top shareholders of Punjab Chemicals include Hemsil Trading And Manufacturing Pvt. Ltd. with 32.76%, Gowal Consulting Services Private Limited at 24.47%, and individual investors holding 19.58%. Foreign institutional investors hold 3.06%, while mutual funds have a minimal stake of 0.01%, with no pledged promoter holdings reported.

The top shareholders of Punjab Chemicals include Hemsil Trading And Manufacturing Pvt. Ltd., which holds the highest promoter stake at 32.76%. The highest public shareholder is Gowal Consulting Services Private Limited, owning 24.47%. Additionally, individual investors collectively hold 19.58% of the shares. The company also has a presence of foreign institutional investors (FIIs) with a combined holding of 3.06% across 10 different FIIs, while mutual funds hold a minimal share of 0.01% through three schemes. There are no pledged promoter holdings reported.

View full answer

When is the next results date for Punjab Chemicals?

06-Jun-2025

No Upcoming Board Meetings

Has Punjab Chemicals declared dividend?

06-Jun-2025

Yes, Punjab Chemicals & Crop Protection Ltd has declared a 30% dividend, amounting to ₹3 per share, with an ex-date of July 25, 2024. The company has shown a total return of 148.63% over the past 5 years, despite varying returns in shorter periods.

Punjab Chemicals & Crop Protection Ltd has declared a 30% dividend.<BR><BR>Dividend Details:<BR>- Percentage announced: 30%<BR>- Amount per share: 3 per share<BR>- Ex-date: 25 Jul 24<BR><BR>Dividend Yield: 0.27%.<BR><BR>Total Returns by Period:<BR>In the last 6 months, the price return was 9.62%, with a dividend return of 0%, resulting in a total return of 9.62%.<BR><BR>Over the 1-year period, the price return was 1.11%, the dividend return was 0.26%, leading to a total return of 1.37%.<BR><BR>For the 2-year period, the price return stood at 30.35%, with a dividend return of 0.67%, culminating in a total return of 31.02%.<BR><BR>In the 3-year timeframe, the price return was -12.83%, the dividend return was 0.77%, resulting in a total return of -12.06%.<BR><BR>For the 4-year period, the price return was -4.79%, with a dividend return of 0.86%, leading to a total return of -3.93%.<BR><BR>Lastly, over the 5-year period, the price return was 145.99%, the dividend return was 2.64%, resulting in a total return of 148.63%.<BR><BR>Overall, Punjab Chemicals has declared a dividend, and while the total returns vary across different periods, the company shows a significant total return over the 5-year period, indicating strong performance despite some fluctuations in shorter timeframes.

View full answer
iScoreScore
Click here to find our call on this stock
Strong Sell
Sell
Hold
Buy
Strong Buy

Dashboard

1

Poor long term growth as Net Sales has grown by an annual rate of 8.71% and Operating profit at 2.00% over the last 5 years

 
2

Flat results in Mar 26

3

Underperformed the market in the last 1 year

stock-summaryMojo Parameters

Mojo Parameters

Loading Valuation Snapshot...

Stock DNA

stock-summary
Industry

Pesticides & Agrochemicals

stock-summary
Market cap

INR 1,400 Cr (Micro Cap)

stock-summary
P/E

22.00

stock-summary
Industry P/E

29

stock-summary
Dividend Yield

0.26%

stock-summary
Debt Equity

0.33

stock-summary
Return on Equity

15.47%

stock-summary
Price to Book

3.36

Revenue and Profits:
Net Sales:
209 Cr
(Quarterly Results - Mar 2026)
Net Profit:
11 Cr
stock-summaryTotal Returns
Total Returns (Price + Dividend) stock-summary
Dividend Yield (0.26%)
TimePeriod
Price Return
Dividend Return
Total Return
3 Months
8.66%
0.28%
8.94%
6 Months
8.36%
0.29%
8.65%
1 Year
-13.73%
0.23%
-13.5%
2 Years
-18.82%
0.44%
-18.38%
3 Years
29.97%
0.92%
30.89%
4 Years
-9.01%
0.94%
-8.07%
5 Years
-18.79%
0.87%
-17.92%

Latest dividend: 3 per share ex-dividend date: Jul-17-2026

Risk Adjusted Returns v/s stock-summary
Returns Beta
Icon
Beta has not been calculated since enough price history is not available
stock-summaryNews & Corporate Actions

Announcements stock-summary

Board Meeting Intimation for Consideration And Approval Of The Unaudited (Standalone And Consolidated) Financial Results Of The Company For The Quarter Ended June 30 2026

14-Jul-2026 | Source : BSE

Punjab Chemicals & Crop Protection Ltd-has informed BSE that the meeting of the Board of Directors of the Company is scheduled on 31/07/2026 inter alia to consider and approve the Unaudited (Standalone and Consolidated) Financial Results of the Company for the quarter ended June 30 2026

Announcement under Regulation 30 (LODR)-Analyst / Investor Meet - Intimation

14-Jul-2026 | Source : BSE

Intimation of Post-Results Conference Call scheduled for Friday July 31 2026 at 4:00 PM.

Announcement under Regulation 30 (LODR)-Newspaper Publication

10-Jul-2026 | Source : BSE

Newspaper Publication in respect of 50th Annual General Meeting of the Company.

Corporate Actions stock-summary

stock-summary
BOARD MEETING

31 Jul 2026

stock-summary
DIVIDEND

Punjab Chemicals & Crop Protection Ltd has declared 30% dividend, ex-date: 17 Jul 26

stock-summary
SPLITS

No Splits history available

stock-summary
BONUS

No Bonus history available

stock-summary
RIGHTS

No Rights history available

stock-summaryKey Factors

Quality key factors stock-summary

Factor
Value
Sales Growth (5y)
8.71%
EBIT Growth (5y)
2.00%
EBIT to Interest (avg)
5.87
Debt to EBITDA (avg)
1.04
Net Debt to Equity (avg)
0.33
Sales to Capital Employed (avg)
2.31
Tax Ratio
24.09%
Dividend Payout Ratio
9.45%
Pledged Shares
0
Institutional Holding
6.50%
ROCE (avg)
25.19%
ROE (avg)
20.38%

Valuation key factors

Factor
Value
P/E Ratio
22
Industry P/E
29
Price to Book Value
3.34
EV to EBIT
17.47
EV to EBITDA
13.22
EV to Capital Employed
2.76
EV to Sales
1.51
PEG Ratio
0.38
Dividend Yield
0.52%
ROCE (Latest)
15.82%
ROE (Latest)
15.47%

Technicals key factors

Indicator
Weekly
Monthly
MACD
Mildly Bullish
Bearish
RSI
No Signal
No Signal
Bollinger Bands
Bullish
Bullish
Moving Averages
Mildly Bearish (Daily)
KST
Mildly Bullish
Mildly Bearish
Dow Theory
Mildly Bullish
Mildly Bullish
OBV
Mildly Bearish
Mildly Bullish
stock-summary Technical Indicator Scale: Bearish, Mildly Bearish, Sideways, Mildly Bullish, Bullish  Turned 
stock-summaryShareholding
Shareholding Snapshot : Jun 2026stock-summary
Shareholding Compare (%holding) stock-summary
Majority shareholders

Non Institution

Pledged Promoter Holdings

None

Mutual Funds

Held by 3 Schemes (0.01%)

FIIs

Held by 8 FIIs (5.86%)

Promoter with highest holding

Hemsil Trading And Manufacturing Pvt. Ltd. (32.76%)

Highest Public shareholder

Gowal Consulting Services Private Limited (21.04%)

Individual Investors Holdings

20.55%

stock-summaryFinancial
[
  {
    "link": "quarterly",
    "btn_text": "All Quarterly Results",
    "header": "Quarterly Results Snapshot (Consolidated) - Mar'26 - QoQ",
    "rhs": [
      {
        "prefix": "Net Sales ",
        "suffix": "QoQ Growth in quarter ended Mar 2026 is -15.42% vs -3.37% in Dec 2025",
        "dir": -1
      },
      {
        "prefix": "Consolidated Net Profit ",
        "suffix": "QoQ Growth in quarter ended Mar 2026 is -20.49% vs -25.51% in Dec 2025",
        "dir": 1
      }
    ],
    "table": {
      "header": [
        "Mar'26",
        "Dec'25",
        "Change(%)"
      ],
      "body": [
        {
          "field": "Net Sales",
          "val1": "208.56",
          "val2": "246.57",
          "chgp": "-15.42%",
          "chgp_class": "negative"
        },
        {
          "field": "Operating Profit (PBDIT) excl Other Income",
          "val1": "27.52",
          "val2": "29.57",
          "chgp": "-6.93%",
          "chgp_class": "negative"
        },
        {
          "field": "Interest",
          "val1": "5.00",
          "val2": "4.08",
          "chgp": "22.55%",
          "chgp_class": "negative"
        },
        {
          "field": "Exceptional Items",
          "val1": "0.00",
          "val2": "-2.08",
          "chgp": "100.00%",
          "chgp_class": "positive"
        },
        {
          "field": "Consolidate Net Profit",
          "val1": "10.98",
          "val2": "13.81",
          "chgp": "-20.49%",
          "chgp_class": "negative"
        },
        {
          "field": "Operating Profit Margin (Excl OI)",
          "val1": "13.20%",
          "val2": "11.99%",
          "chgp": "1.21%",
          "chgp_class": "positive"
        }
      ]
    }
  },
  {
    "link": "half-yearly",
    "btn_text": "All Half Yearly Results",
    "header": "Half Yearly Results Snapshot (Consolidated) - Sep'25",
    "rhs": [
      {
        "prefix": "Net Sales ",
        "suffix": " Growth in half year ended Sep 2025 is 18.65% vs -7.49% in Sep 2024",
        "dir": 1
      },
      {
        "prefix": "Consolidated Net Profit ",
        "suffix": " Growth in half year ended Sep 2025 is 51.76% vs -35.44% in Sep 2024",
        "dir": 1
      }
    ],
    "table": {
      "header": [
        "Sep'25",
        "Sep'24",
        "Change(%)"
      ],
      "body": [
        {
          "field": "Net Sales",
          "val1": "574.67",
          "val2": "484.35",
          "chgp": "18.65%",
          "chgp_class": "positive"
        },
        {
          "field": "Operating Profit (PBDIT) excl Other Income",
          "val1": "60.60",
          "val2": "53.59",
          "chgp": "13.08%",
          "chgp_class": "positive"
        },
        {
          "field": "Interest",
          "val1": "7.74",
          "val2": "8.62",
          "chgp": "-10.21%",
          "chgp_class": "positive"
        },
        {
          "field": "Exceptional Items",
          "val1": "0.00",
          "val2": "0.00",
          "chgp": "",
          "chgp_class": "neutral"
        },
        {
          "field": "Consolidate Net Profit",
          "val1": "39.17",
          "val2": "25.81",
          "chgp": "51.76%",
          "chgp_class": "positive"
        },
        {
          "field": "Operating Profit Margin (Excl OI)",
          "val1": "10.55%",
          "val2": "11.06%",
          "chgp": "-0.51%",
          "chgp_class": "negative"
        }
      ]
    }
  },
  {
    "link": "nine-monthly",
    "btn_text": "All Nine Monthly Results",
    "header": "Nine Monthly Results Snapshot (Consolidated) - Dec'25",
    "rhs": [
      {
        "prefix": "Net Sales ",
        "suffix": "YoY Growth in nine months ended Dec 2025 is 17.62% vs -5.35% in Dec 2024",
        "dir": 1
      },
      {
        "prefix": "Consolidated Net Profit ",
        "suffix": "YoY Growth in nine months ended Dec 2025 is 66.19% vs -37.71% in Dec 2024",
        "dir": 1
      }
    ],
    "table": {
      "header": [
        "Dec'25",
        "Dec'24",
        "Change(%)"
      ],
      "body": [
        {
          "field": "Net Sales",
          "val1": "821.24",
          "val2": "698.24",
          "chgp": "17.62%",
          "chgp_class": "positive"
        },
        {
          "field": "Operating Profit (PBDIT) excl Other Income",
          "val1": "90.17",
          "val2": "72.85",
          "chgp": "23.77%",
          "chgp_class": "positive"
        },
        {
          "field": "Interest",
          "val1": "11.82",
          "val2": "13.08",
          "chgp": "-9.63%",
          "chgp_class": "positive"
        },
        {
          "field": "Exceptional Items",
          "val1": "-2.08",
          "val2": "0.00",
          "chgp": "",
          "chgp_class": "neutral"
        },
        {
          "field": "Consolidate Net Profit",
          "val1": "52.98",
          "val2": "31.88",
          "chgp": "66.19%",
          "chgp_class": "positive"
        },
        {
          "field": "Operating Profit Margin (Excl OI)",
          "val1": "10.98%",
          "val2": "10.43%",
          "chgp": "0.55%",
          "chgp_class": "positive"
        }
      ]
    }
  },
  {
    "link": "annual",
    "btn_text": "All Annual Results",
    "header": "Annual Results Snapshot (Consolidated) - Mar'26",
    "rhs": [
      {
        "prefix": "Net Sales ",
        "suffix": "YoY Growth in year ended Mar 2026 is 14.36% vs -3.61% in Mar 2025",
        "dir": 1
      },
      {
        "prefix": "Consolidated Net Profit ",
        "suffix": "YoY Growth in year ended Mar 2026 is 64.29% vs -27.34% in Mar 2025",
        "dir": 1
      }
    ],
    "table": {
      "header": [
        "Mar'26",
        "Mar'25",
        "Change(%)"
      ],
      "body": [
        {
          "field": "Net Sales",
          "val1": "1,029.80",
          "val2": "900.52",
          "chgp": "14.36%",
          "chgp_class": "positive"
        },
        {
          "field": "Operating Profit (PBDIT) excl Other Income",
          "val1": "118.13",
          "val2": "99.19",
          "chgp": "19.09%",
          "chgp_class": "positive"
        },
        {
          "field": "Interest",
          "val1": "16.82",
          "val2": "17.83",
          "chgp": "-5.66%",
          "chgp_class": "positive"
        },
        {
          "field": "Exceptional Items",
          "val1": "-2.08",
          "val2": "-4.18",
          "chgp": "50.24%",
          "chgp_class": "positive"
        },
        {
          "field": "Consolidate Net Profit",
          "val1": "63.96",
          "val2": "38.93",
          "chgp": "64.29%",
          "chgp_class": "positive"
        },
        {
          "field": "Operating Profit Margin (Excl OI)",
          "val1": "11.47%",
          "val2": "11.01%",
          "chgp": "0.46%",
          "chgp_class": "positive"
        }
      ]
    }
  }
]

Quarterly Results Snapshot (Consolidated) - Mar'26 - QoQstock-summary

Mar'26
Dec'25
Change(%)
Net Sales
208.56
246.57
-15.42%
Operating Profit (PBDIT) excl Other Income
27.52
29.57
-6.93%
Interest
5.00
4.08
22.55%
Exceptional Items
0.00
-2.08
100.00%
Consolidate Net Profit
10.98
13.81
-20.49%
Operating Profit Margin (Excl OI)
13.20%
11.99%
1.21%
Values in Rs Cr.
Direction Arrows
Net Sales

QoQ Growth in quarter ended Mar 2026 is -15.42% vs -3.37% in Dec 2025

Direction Arrows
Consolidated Net Profit

QoQ Growth in quarter ended Mar 2026 is -20.49% vs -25.51% in Dec 2025

Half Yearly Results Snapshot (Consolidated) - Sep'25stock-summary

Sep'25
Sep'24
Change(%)
Net Sales
574.67
484.35
18.65%
Operating Profit (PBDIT) excl Other Income
60.60
53.59
13.08%
Interest
7.74
8.62
-10.21%
Exceptional Items
0.00
0.00
Consolidate Net Profit
39.17
25.81
51.76%
Operating Profit Margin (Excl OI)
10.55%
11.06%
-0.51%
Values in Rs Cr.
Direction Arrows
Net Sales

Growth in half year ended Sep 2025 is 18.65% vs -7.49% in Sep 2024

Direction Arrows
Consolidated Net Profit

Growth in half year ended Sep 2025 is 51.76% vs -35.44% in Sep 2024

Nine Monthly Results Snapshot (Consolidated) - Dec'25stock-summary

Dec'25
Dec'24
Change(%)
Net Sales
821.24
698.24
17.62%
Operating Profit (PBDIT) excl Other Income
90.17
72.85
23.77%
Interest
11.82
13.08
-9.63%
Exceptional Items
-2.08
0.00
Consolidate Net Profit
52.98
31.88
66.19%
Operating Profit Margin (Excl OI)
10.98%
10.43%
0.55%
Values in Rs Cr.
Direction Arrows
Net Sales

YoY Growth in nine months ended Dec 2025 is 17.62% vs -5.35% in Dec 2024

Direction Arrows
Consolidated Net Profit

YoY Growth in nine months ended Dec 2025 is 66.19% vs -37.71% in Dec 2024

Annual Results Snapshot (Consolidated) - Mar'26stock-summary

Mar'26
Mar'25
Change(%)
Net Sales
1,029.80
900.52
14.36%
Operating Profit (PBDIT) excl Other Income
118.13
99.19
19.09%
Interest
16.82
17.83
-5.66%
Exceptional Items
-2.08
-4.18
50.24%
Consolidate Net Profit
63.96
38.93
64.29%
Operating Profit Margin (Excl OI)
11.47%
11.01%
0.46%
Values in Rs Cr.
Direction Arrows
Net Sales

YoY Growth in year ended Mar 2026 is 14.36% vs -3.61% in Mar 2025

Direction Arrows
Consolidated Net Profit

YoY Growth in year ended Mar 2026 is 64.29% vs -27.34% in Mar 2025

stock-summaryCompany CV
About Punjab Chemicals & Crop Protection Ltd stock-summary
stock-summary
Punjab Chemicals & Crop Protection Ltd
Micro Cap
Pesticides & Agrochemicals
Punjab Chemicals & Crop Protection Limited, formerly known as Punjab Chemicals & Pharmaceuticals Limited was incorporated in 1975 and was promoted by Excel Industries and the Punjab State Industrial Development Corporation. The name of the Company was changed to Punjab Chemicals & Crop Protection Limited in November, 2004. Company has evolved into a leading manufacturer of agrochemicals, speciality chemicals and industrial chemicals.
Company Coordinates stock-summary
Company Details
Milestone 18 Ambala Kalka Road, Vill PO Bhankharpur Derabassi Mohali Punjab : 140201
stock-summary
Tel: 91-1762-280086/280094
stock-summary
info@punjabchemicals.com
Registrar Details
Alankit Assignments Ltd , Alankit House , 2 E/21, Jhandewala Extension, New Delhi