
Compare PVP Ventures with Similar Stocks
Dashboard
High Debt company with Weak Long Term Fundamental Strength
- Poor long term growth as Operating profit has grown by an annual rate 18.98% of over the last 5 years
- High Debt Company with a Debt to Equity ratio (avg) of 6.62 times
- The company has been able to generate a Return on Capital Employed (avg) of 7.78% signifying low profitability per unit of total capital (equity and debt)
With ROCE of 1.4, it has a Very Expensive valuation with a 2.2 Enterprise value to Capital Employed
Despite the size of the company, domestic mutual funds hold only 0% of the company
Stock DNA
Realty
INR 750 Cr (Micro Cap)
NA (Loss Making)
38
0.00%
0.94
-1.71%
3.47
Total Returns (Price + Dividend) 
PVP Ventures for the last several years.
Risk Adjusted Returns v/s
Returns Beta

News
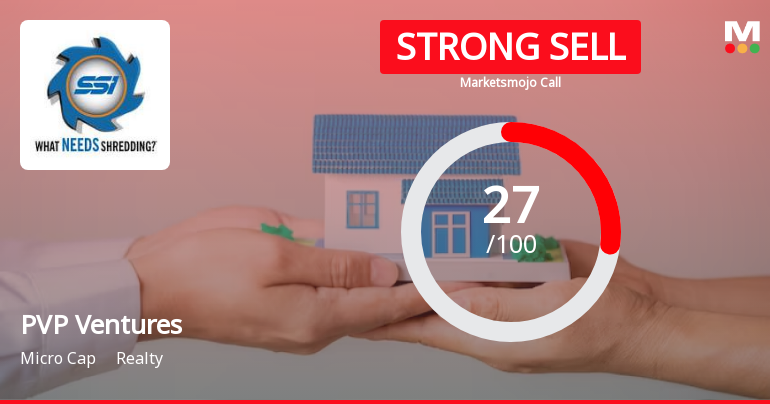
PVP Ventures Ltd is Rated Strong Sell
PVP Ventures Ltd is rated Strong Sell by MarketsMOJO, with this rating last updated on 16 June 2026. However, the analysis and financial metrics discussed here reflect the stock’s current position as of 20 July 2026, providing investors with the most up-to-date view of the company’s fundamentals, valuation, financial trend, and technical outlook.
Read full news article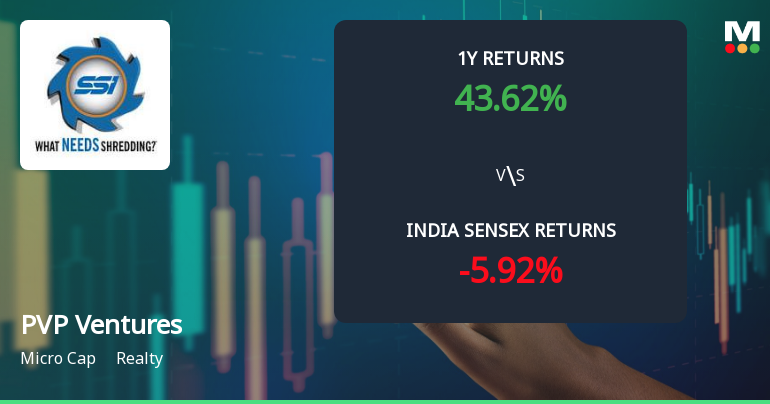
PVP Ventures Ltd Technical Momentum Shifts Amid Mixed Market Signals
PVP Ventures Ltd has experienced a notable shift in its technical momentum, moving from a bearish stance to a mildly bearish trend, reflecting a complex interplay of technical indicators. Despite a strong one-week price rally of 6.14%, the company’s overall outlook remains cautious with a MarketsMOJO Mojo Grade downgraded to Strong Sell as of 16 June 2026.
Read full news article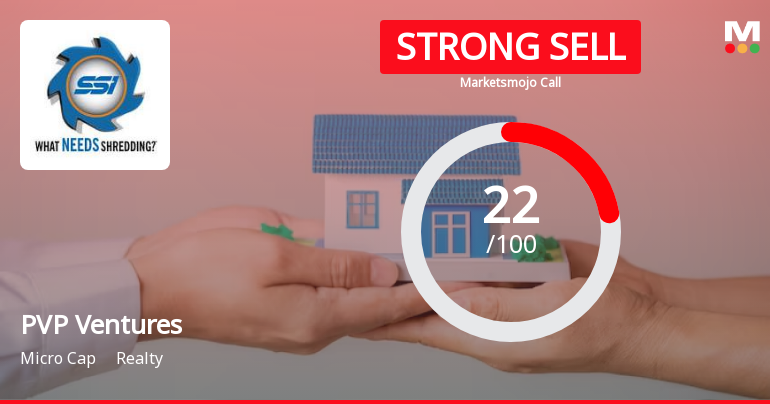
PVP Ventures Ltd is Rated Strong Sell
PVP Ventures Ltd is rated Strong Sell by MarketsMOJO, with this rating last updated on 16 June 2026. However, the analysis and financial metrics discussed here reflect the company’s current position as of 09 July 2026, providing investors with the latest insights into its fundamentals, valuation, financial trends, and technical outlook.
Read full news article Announcements
PVP Ventures Limited - Outcome of Board Meeting
14-Nov-2019 | Source : NSEPVP Ventures Limited has informed the Exchange regarding Board meeting held on November 13, 2019.
PVP Ventures Limited - Reply to Clarification- Financial results
13-Nov-2019 | Source : NSEPVP Ventures Limitedres Limited for the quarter ended 30-Jun-2019 with respect to Regulation 33 of the SEBI (Listing Obligations and Disclosure Requirements) Regulations, 2015.
PVP Ventures Limited - Outcome of Board Meeting
08-Nov-2019 | Source : NSEPVP Ventures Limited has informed the Exchange regarding Outcome of Board Meeting held on November 07, 2019.
Corporate Actions

No Upcoming Board Meetings

No Dividend history available

No Splits history available

No Bonus history available

No Rights history available
Quality key factors
Valuation key factors
Technicals key factors
 Technical Indicator Scale: Bearish, Mildly Bearish, Sideways, Mildly Bullish, Bullish Turned
 Shareholding Snapshot : Mar 2026
Shareholding Compare (%holding)
Promoters
None
Held by 1 Schemes (0.0%)
Held by 5 FIIs (0.5%)
Platex Limited (50.93%)
Vivek Mundra (2.2%)
26.85%
Quarterly Results Snapshot (Consolidated) - Mar'26 - QoQ

QoQ Growth in quarter ended Mar 2026 is 196.85% vs -18.31% in Dec 2025
QoQ Growth in quarter ended Mar 2026 is 89.55% vs -11.32% in Dec 2025
Half Yearly Results Snapshot (Consolidated) - Sep'25

Growth in half year ended Sep 2025 is 501.75% vs 1,087.50% in Sep 2024
Growth in half year ended Sep 2025 is 37.31% vs 42.59% in Sep 2024
Nine Monthly Results Snapshot (Consolidated) - Dec'25
YoY Growth in nine months ended Dec 2025 is 489.98% vs 70.42% in Dec 2024
YoY Growth in nine months ended Dec 2025 is -26.82% vs -108.54% in Dec 2024
Annual Results Snapshot (Consolidated) - Mar'26
YoY Growth in year ended Mar 2026 is 229.82% vs 221.13% in Mar 2025
YoY Growth in year ended Mar 2026 is -1.04% vs -110.04% in Mar 2025
About PVP Ventures Ltd

Company Coordinates


