
Compare PVP Ventures with Similar Stocks
Dashboard
High Debt company with Weak Long Term Fundamental Strength
- Poor long term growth as Operating profit has grown by an annual rate 18.98% of over the last 5 years
- High Debt Company with a Debt to Equity ratio (avg) of 6.62 times
- The company has been able to generate a Return on Capital Employed (avg) of 7.78% signifying low profitability per unit of total capital (equity and debt)
With ROCE of 1.4, it has a Very Expensive valuation with a 2.4 Enterprise value to Capital Employed
Despite the size of the company, domestic mutual funds hold only 0% of the company
Stock DNA
Realty
INR 819 Cr (Micro Cap)
NA (Loss Making)
32
0.00%
0.94
-1.71%
3.68
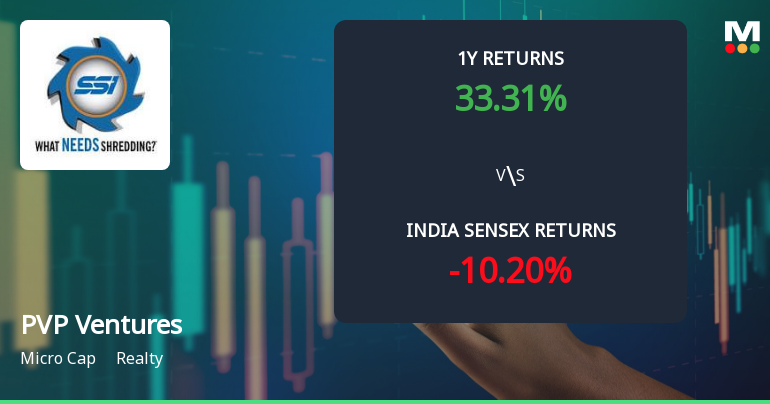
Total Returns (Price + Dividend) 
PVP Ventures for the last several years.
Risk Adjusted Returns v/s
Returns Beta

News
PVP Ventures Ltd Technical Momentum Shifts Amid Mixed Indicator Signals
PVP Ventures Ltd, a micro-cap player in the Realty sector, has exhibited a notable shift in its technical momentum, moving from a sideways trend to a mildly bullish stance. Despite a modest day gain of 2.04%, the stock’s technical indicators present a complex picture, with weekly and monthly signals diverging across key metrics such as MACD, RSI, and moving averages. This nuanced technical landscape warrants close attention from investors seeking to understand the stock’s near-term trajectory and longer-term potential.
Read full news article
PVP Ventures Ltd is Rated Strong Sell
PVP Ventures Ltd is rated Strong Sell by MarketsMOJO, with this rating last updated on 19 Feb 2026. However, the analysis and financial metrics discussed here reflect the stock’s current position as of 04 June 2026, providing investors with an up-to-date view of the company’s fundamentals, valuation, financial trends, and technical outlook.
Read full news article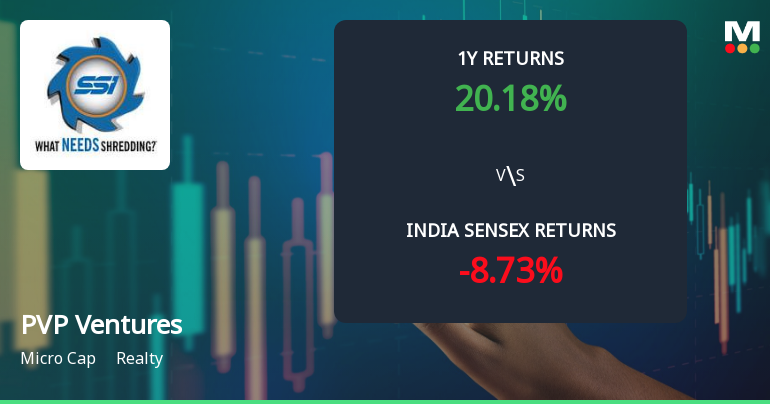
PVP Ventures Ltd Technical Momentum Shifts Amid Mixed Market Signals
PVP Ventures Ltd, a micro-cap player in the Realty sector, has experienced a notable shift in price momentum and technical indicators, reflecting a complex market sentiment. Despite a strong day change of 8.98%, the company’s technical parameters present a mixed picture, with some indicators signalling mild bearishness while others hint at potential bullish undertones.
Read full news article Announcements
Reconstitution Of The Committees.
29-May-2026 | Source : BSEReconstitution of the Committees.
Corporate Action-Updates on Amalgamation/ Merger / Demerger
29-May-2026 | Source : BSEBoard approves merger of PVP Corporate Parks Private Limited a WOS of PVP Ventures Limited with the Holding Company.
Financial Results
29-May-2026 | Source : BSEFinancial Results
Corporate Actions

No Upcoming Board Meetings

No Dividend history available

No Splits history available

No Bonus history available

No Rights history available
Quality key factors
Valuation key factors
Technicals key factors
 Technical Indicator Scale: Bearish, Mildly Bearish, Sideways, Mildly Bullish, Bullish Turned
 Shareholding Snapshot : Mar 2026
Shareholding Compare (%holding)
Promoters
None
Held by 1 Schemes (0.0%)
Held by 5 FIIs (0.5%)
Platex Limited (50.93%)
Vivek Mundra (2.2%)
26.85%
Quarterly Results Snapshot (Consolidated) - Mar'26 - QoQ

QoQ Growth in quarter ended Mar 2026 is 196.85% vs -18.31% in Dec 2025
QoQ Growth in quarter ended Mar 2026 is 89.55% vs -11.32% in Dec 2025
Half Yearly Results Snapshot (Consolidated) - Sep'25

Growth in half year ended Sep 2025 is 501.75% vs 1,087.50% in Sep 2024
Growth in half year ended Sep 2025 is 37.31% vs 42.59% in Sep 2024
Nine Monthly Results Snapshot (Consolidated) - Dec'25
YoY Growth in nine months ended Dec 2025 is 489.98% vs 70.42% in Dec 2024
YoY Growth in nine months ended Dec 2025 is -26.82% vs -108.54% in Dec 2024
Annual Results Snapshot (Consolidated) - Mar'26
YoY Growth in year ended Mar 2026 is 229.82% vs 221.13% in Mar 2025
YoY Growth in year ended Mar 2026 is -1.04% vs -110.04% in Mar 2025
About PVP Ventures Ltd

Company Coordinates


