
Compare PVV Infra Ltd with Similar Stocks
Total Returns (Price + Dividend) 
PVV Infra Ltd for the last several years.
Risk Adjusted Returns v/s
Returns Beta

News

PVV Infra Ltd Downgraded to Sell Amid Mixed Financial and Quality Signals
PVV Infra Ltd, a micro-cap player in the construction sector, has seen its investment rating downgraded from Hold to Sell as of 1 June 2026. This shift reflects a complex interplay of factors across financial trends, valuation, quality metrics, and technical indicators, signalling caution for investors despite pockets of positive performance.
Read full news article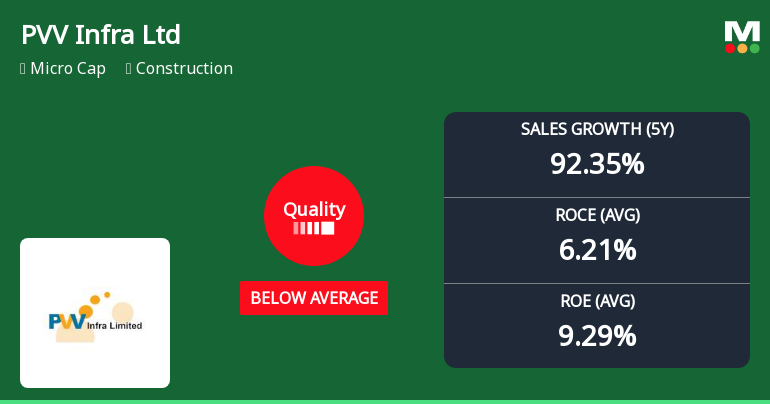
PVV Infra Ltd Downgraded to Sell as Quality Parameters Deteriorate
PVV Infra Ltd, a micro-cap player in the construction sector, has seen its quality rating downgraded from average to below average, prompting a shift in its MarketsMOJO grade from Hold to Sell as of 1 June 2026. This change reflects a nuanced deterioration in key business fundamentals, despite some encouraging long-term returns and growth figures.
Read full news article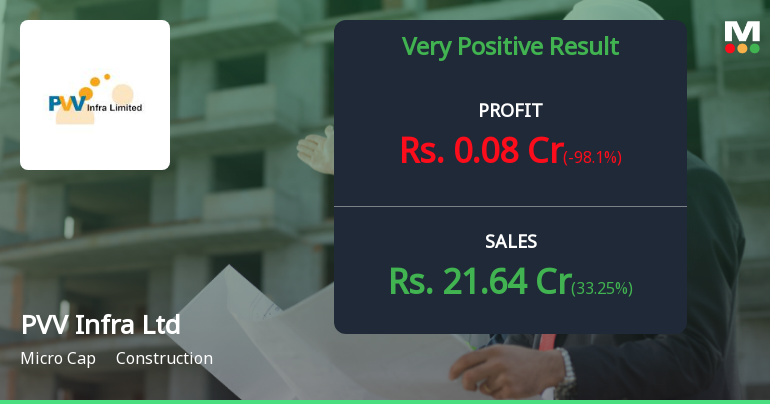
PVV Infra Q4 FY26: Margin Collapse Raises Serious Questions Despite Revenue Growth
PVV Infra Ltd., a micro-cap construction company with a market capitalisation of ₹86.00 crores, reported a concerning fourth quarter for FY26 that has left investors questioning the sustainability of its recent growth trajectory. The company posted a net profit of just ₹0.08 crores in Q4 FY26, representing a staggering 98.10% decline quarter-on-quarter and an 84.91% drop year-on-year, despite achieving record quarterly revenue of ₹21.64 crores.
Read full news article Announcements
Revised Corrigendum To The Notice Of Extraordinary General Meeting
09-Jun-2026 | Source : BSECorrigendum
Announcement under Regulation 30 (LODR)-Newspaper Publication
08-Jun-2026 | Source : BSECorrigendum
Corrigendum To The Notice Of Extraordinary General Meeting
06-Jun-2026 | Source : BSECorrigendum
Corporate Actions

No Upcoming Board Meetings

No Dividend history available

PVV Infra Ltd has announced 1:5 stock split, ex-date: 27 Mar 26

PVV Infra Ltd has announced 1:1 bonus issue, ex-date: 20 Aug 24

PVV Infra Ltd has announced 6:7 rights issue, ex-date: 05 Feb 26
Quality key factors
Valuation key factors
Technicals key factors
 Technical Indicator Scale: Bearish, Mildly Bearish, Sideways, Mildly Bullish, Bullish Turned
 Shareholding Snapshot : Mar 2026
Shareholding Compare (%holding)
Non Institution
None
Held by 0 Schemes
Held by 0 FIIs
Pinnamaneni Estates Private Limited (20.85%)
Vakkala Enterprises Llp (3.75%)
44.26%
Quarterly Results Snapshot (Consolidated) - Mar'26 - QoQ

QoQ Growth in quarter ended Mar 2026 is 33.25% vs 48.58% in Dec 2025
QoQ Growth in quarter ended Mar 2026 is -98.10% vs 99.53% in Dec 2025
Half Yearly Results Snapshot (Standalone) - Sep'25

Growth in half year ended Sep 2025 is -24.72% vs -56.46% in Sep 2024
Growth in half year ended Sep 2025 is -41.12% vs 1,323.53% in Sep 2024
Nine Monthly Results Snapshot (Standalone) - Dec'25
YoY Growth in nine months ended Dec 2025 is 5.52% vs -56.23% in Dec 2024
YoY Growth in nine months ended Dec 2025 is 42.34% vs 293.65% in Dec 2024
Annual Results Snapshot (Consolidated) - Mar'26
YoY Growth in year ended Mar 2026 is 42.16% vs -54.67% in Mar 2025
YoY Growth in year ended Mar 2026 is 30.47% vs 77.35% in Mar 2025
About PVV Infra Ltd

Company Coordinates


