
Compare QMS Medical with Similar Stocks
Dashboard
Poor long term growth as Net Sales has grown by an annual rate of 13.54% and Operating profit at 18.37% over the last 5 years
Negative results in Mar 26
With ROCE of 13.3, it has a Attractive valuation with a 1.7 Enterprise value to Capital Employed
Majority shareholders : Promoters
Below par performance in long term as well as near term
Stock DNA
Healthcare Services
INR 218 Cr (Micro Cap)
21.00
98
0.45%
0.58
9.76%
2.05
Total Returns (Price + Dividend) 
Latest dividend: 0.5 per share ex-dividend date: Sep-22-2025
Risk Adjusted Returns v/s
Returns Beta

News
QMS Medical Allied Services Ltd is Rated Hold
QMS Medical Allied Services Ltd is rated 'Hold' by MarketsMOJO, with this rating last updated on 06 July 2026. However, the analysis and financial metrics discussed here reflect the stock's current position as of 15 July 2026, providing investors with the most up-to-date view of the company’s performance and outlook.
Read full news article
QMS Medical Allied Services Ltd is Rated Sell
QMS Medical Allied Services Ltd is rated Sell by MarketsMOJO. This rating was last updated on 29 June 2026, reflecting a change from the previous Hold rating. However, all fundamentals, returns, and financial metrics discussed here are current as of 04 July 2026, providing investors with the latest assessment of the stock’s position.
Read full news article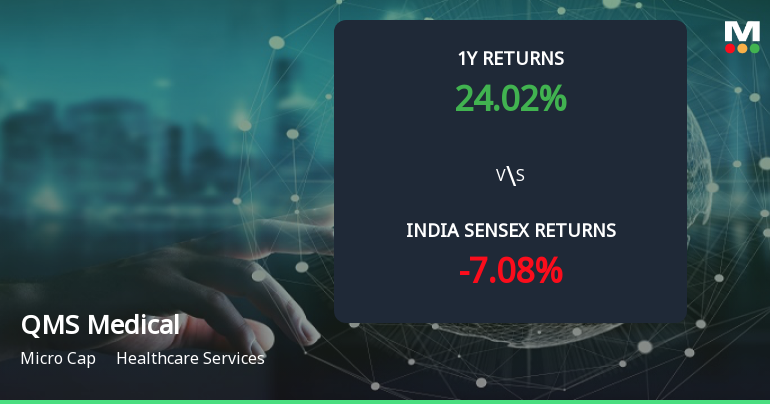
Golden Cross Forms in QMS Medical Allied Services Ltd — On a Day the Stock Rose 2.26%. What the Mixed Signals Mean
The 50-day moving average has crossed above the 200-day moving average for QMS Medical Allied Services Ltd, signalling a golden cross on 2 Jul 2026. Yet, the broader technical and fundamental context presents a nuanced picture that tempers the enthusiasm this crossover might otherwise inspire.
Read full news article Announcements
Corporate Actions

No Upcoming Board Meetings

QMS Medical Allied Services Ltd has declared 5% dividend, ex-date: 22 Sep 25

No Splits history available

No Bonus history available

QMS Medical Allied Services Ltd has announced 1:12 rights issue, ex-date: 04 Sep 25
Quality key factors
Valuation key factors
Technicals key factors
 Technical Indicator Scale: Bearish, Mildly Bearish, Sideways, Mildly Bullish, Bullish Turned
 Shareholding Snapshot : Jun 2026
Shareholding Compare (%holding)
Promoters
None
Held by 0 Schemes
Held by 0 FIIs
Mahesh Pahalraj Makhija (66.45%)
None
26.54%
Quarterly Results Snapshot (Consolidated) - Mar'26 - QoQ

QoQ Growth in quarter ended Mar 2026 is 19.22% vs -16.64% in Dec 2025

QoQ Growth in quarter ended Mar 2026 is -28.33% vs -23.08% in Dec 2025
Half Yearly Results Snapshot (Consolidated) - Mar'26
Growth in half year ended Mar 2026 is -10.44% vs 3.11% in Sep 2025
Growth in half year ended Mar 2026 is -32.56% vs -3.35% in Sep 2025
Nine Monthly Results Snapshot (Standalone) - Dec'25
YoY Growth in nine months ended Dec 2025 is 10.36% vs 14.08% in Dec 2024
YoY Growth in nine months ended Dec 2025 is -19.57% vs -1.34% in Dec 2024
Annual Results Snapshot (Consolidated) - Mar'26
YoY Growth in year ended Mar 2026 is 10.81% vs 27.74% in Mar 2025
YoY Growth in year ended Mar 2026 is -16.21% vs 34.33% in Mar 2025
About QMS Medical Allied Services Ltd

Company Coordinates


