
Compare Quality Power El with Similar Stocks
Dashboard
Strong Long Term Fundamental Strength with an average Return on Equity (ROE) of 22.38%
- Healthy long term growth as Net Sales has grown by an annual rate of 77.20% and Operating profit at 114.57%
- The company is Net-Debt Free
The company has declared Positive results for the last 4 consecutive quarters
With ROE of 22.4, it has a Very Expensive valuation with a 16.2 Price to Book Value
Increasing Participation by Institutional Investors
Market Beating Performance
Stock DNA
Heavy Electrical Equipment
INR 8,712 Cr (Small Cap)
72.00
42
0.09%
-0.39
22.38%
15.46
Total Returns (Price + Dividend) 
Latest dividend: 1 per share ex-dividend date: Sep-18-2025
Risk Adjusted Returns v/s
Returns Beta

News

Quality Power Electrical Equipments Ltd Locks at Upper Circuit With 5% Gain — Buyers Queue, Sellers Absent
At Rs 1,133.3, the buying was done — not because demand dried up, but because the exchange wouldn't let the stock go any higher. Quality Power Electrical Equipments Ltd locked at its upper circuit of 5.00% on 31 Jul 2026, with buyers queuing and no sellers willing to part with shares.
Read full news article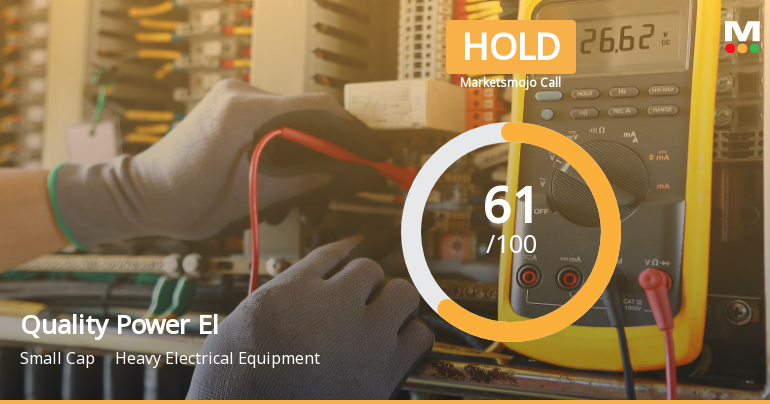
Quality Power Electrical Equipments Ltd Downgraded to Hold Amid Technical Weakness
Quality Power Electrical Equipments Ltd, a notable player in the Heavy Electrical Equipment sector, has seen its investment rating downgraded from Buy to Hold as of 28 July 2026. This adjustment reflects a nuanced reassessment across four critical parameters: quality, valuation, financial trend, and technical indicators. Despite strong fundamentals and impressive returns, evolving technical signals and valuation concerns have tempered the outlook for investors.
Read full news article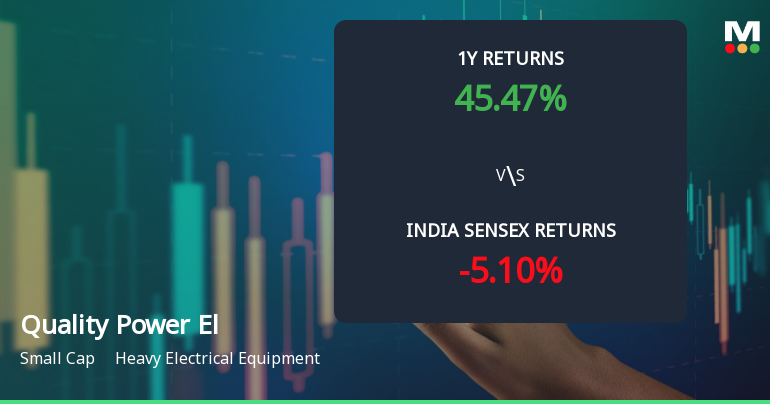
Quality Power Electrical Equipments Ltd Sees Technical Momentum Shift Amid Mixed Signals
Quality Power Electrical Equipments Ltd, a small-cap player in the Heavy Electrical Equipment sector, has experienced a notable shift in its technical momentum, moving from a mildly bullish stance to a sideways trend. Despite a marginal day change of 0.03% with the stock closing at ₹1,105.30, the evolving technical indicators suggest a nuanced outlook for investors navigating this stock amid broader market fluctuations.
Read full news article Announcements
Corporate Actions

No Upcoming Board Meetings

Quality Power Electrical Equipments Ltd has declared 10% dividend, ex-date: 18 Sep 25

No Splits history available

No Bonus history available

No Rights history available
Quality key factors
Valuation key factors
Technicals key factors
 Technical Indicator Scale: Bearish, Mildly Bearish, Sideways, Mildly Bullish, Bullish Turned
 Shareholding Snapshot : Jun 2026
Shareholding Compare (%holding)
Promoters
None
Held by 9 Schemes (4.17%)
Held by 28 FIIs (3.36%)
Bharanidharan Pandyan (36.96%)
Bank Of India Flexi Cap Fund (3.35%)
13.21%
Quarterly Results Snapshot (Consolidated) - Mar'26 - QoQ

QoQ Growth in quarter ended Mar 2026 is -1.12% vs 38.02% in Dec 2025
QoQ Growth in quarter ended Mar 2026 is -12.80% vs 59.97% in Dec 2025
Half Yearly Results Snapshot (Standalone) - Sep'25
Not Applicable: The company has declared_date for only one period
Not Applicable: The company has declared_date for only one period
Nine Monthly Results Snapshot (Standalone) - Dec'25
Not Applicable: The company has declared_date for only one period
Not Applicable: The company has declared_date for only one period
Annual Results Snapshot (Consolidated) - Mar'26

YoY Growth in year ended Mar 2026 is 180.03% vs 12.08% in Mar 2025
YoY Growth in year ended Mar 2026 is 83.38% vs 76.74% in Mar 2025
About Quality Power Electrical Equipments Ltd

Company Coordinates


