
Compare Quantum Digital with Similar Stocks
Dashboard
With a Negative Book Value, the company has a Weak Long Term Fundamental Strength
- Poor long term growth as Net Sales has grown by an annual rate of 27.35% and Operating profit at 0% over the last 5 years
- The company has a negative book value of Rs 3.90 crore
Flat results in Mar 26
Risky - Negative EBITDA
Underperformed the market in the last 1 year
Stock DNA
Packaging
INR 7 Cr (Micro Cap)
NA (Loss Making)
14
0.00%
-0.45
11.79%
-1.79
Total Returns (Price + Dividend) 
Quantum Digital for the last several years.
Risk Adjusted Returns v/s
Returns Beta

News
Are Quantum Digital Vision India Ltd latest results good or bad?
Quantum Digital Vision India Ltd's latest financial results for Q4 FY26 reveal a company grappling with significant operational challenges. The company reported net sales of ₹2.35 crores, marking its first revenue generation after three consecutive quarters of zero sales. However, this revenue generation did not alleviate the financial strain, as the company incurred a net loss of ₹0.19 crores, which represents a widening loss compared to the previous quarter's net loss of ₹0.29 crores. The operating margin stood at -7.66%, indicating that the company is operating at a loss even before accounting for financial costs. This negative margin reflects ongoing operational inefficiencies and challenges in achieving profitability. Additionally, the book value per share is reported at -₹24.42, highlighting a negative equity position that raises concerns about the company's financial stability. Year-on-year compari...
Read full news article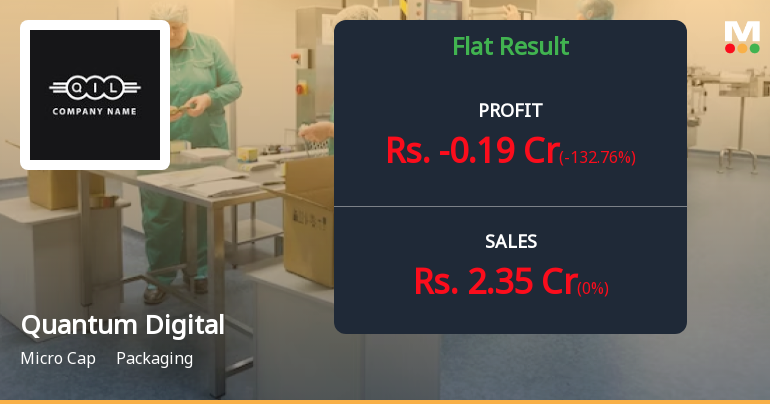
Quantum Digital Vision India Q4 FY26: Operational Losses Deepen Despite Revenue Resumption
Quantum Digital Vision India Ltd., a micro-cap packaging company with a market capitalisation of ₹6.00 crores, reported a net loss of ₹0.19 crores in Q4 FY26, marking a continuation of its troubled operational trajectory despite generating its first quarterly revenue in over a year. The stock, currently trading at ₹20.00, has declined 26.61% over the past twelve months, significantly underperforming both the broader market and its packaging sector peers.
Read full news article Announcements
Closure of Trading Window
26-Jun-2026 | Source : BSECLOSURE OF TRADING WINDOW
NEWSPAPER PUBLICATION
28-May-2026 | Source : BSENEWSPAPER PUBLICATION
Board Meeting Outcome for OUTCOME OF BOARD MEETING
26-May-2026 | Source : BSEOUTCOME OF BOARD MEETING
Corporate Actions

No Upcoming Board Meetings

No Dividend history available

No Splits history available

No Bonus history available

No Rights history available
Quality key factors
Valuation key factors
Technicals key factors
 Technical Indicator Scale: Bearish, Mildly Bearish, Sideways, Mildly Bullish, Bullish Turned
 Shareholding Snapshot : Mar 2026
Shareholding Compare (%holding)
Non Institution
None
Held by 0 Schemes
Held by 0 FIIs
Cyma Dassani Marketing Pvt Ltd (30.74%)
Dushyant Bapna (8.22%)
43.02%
Quarterly Results Snapshot (Standalone) - Mar'26 - YoY
YoY Growth in quarter ended Mar 2026 is 0.00% vs 0.00% in Mar 2025

YoY Growth in quarter ended Mar 2026 is -132.76% vs 1,550.00% in Mar 2025
Half Yearly Results Snapshot (Standalone) - Sep'25

Growth in half year ended Sep 2025 is 0.00% vs -100.00% in Sep 2024
Growth in half year ended Sep 2025 is -76.92% vs 137.14% in Sep 2024
Nine Monthly Results Snapshot (Standalone) - Dec'25
YoY Growth in nine months ended Dec 2025 is 0.00% vs -100.00% in Dec 2024
YoY Growth in nine months ended Dec 2025 is -750.00% vs -98.63% in Dec 2024
Annual Results Snapshot (Standalone) - Mar'26
YoY Growth in year ended Mar 2026 is 0.00% vs -100.00% in Mar 2025
YoY Growth in year ended Mar 2026 is -171.43% vs -77.97% in Mar 2025
About Quantum Digital Vision India Ltd

Company Coordinates


