
Compare R K Swamy with Similar Stocks
Dashboard
The company is Net-Debt Free
Poor long term growth as Operating profit has grown by an annual rate -33.01% of over the last 5 years
Positive results in Mar 26
With ROE of 9.4, it has a Attractive valuation with a 1.9 Price to Book Value
Falling Participation by Institutional Investors
Below par performance in long term as well as near term
Stock DNA
Media & Entertainment
INR 499 Cr (Micro Cap)
20.00
32
1.52%
-0.35
9.41%
1.88
Total Returns (Price + Dividend) 
Latest dividend: 1.5 per share ex-dividend date: Aug-19-2025
Risk Adjusted Returns v/s
Returns Beta

News

R K Swamy Ltd Upgraded to Hold by MarketsMOJO Amid Mixed Financial and Technical Signals
R K Swamy Ltd, a micro-cap player in the Media & Entertainment sector, has seen its investment rating upgraded from Sell to Hold as of 11 June 2026. This change reflects a nuanced improvement across technical indicators, valuation metrics, financial trends, and overall quality assessment, signalling a cautious but positive outlook for investors.
Read full news article
R K Swamy Ltd is Rated Sell
R K Swamy Ltd is rated 'Sell' by MarketsMOJO, with this rating last updated on 22 Dec 2025. However, the analysis and financial metrics discussed here reflect the stock's current position as of 10 June 2026, providing investors with an up-to-date perspective on the company’s fundamentals, valuation, financial trends, and technical outlook.
Read full news article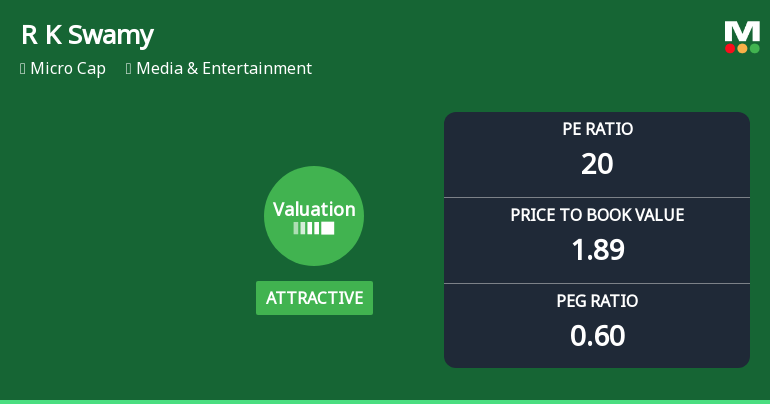
R K Swamy Ltd Valuation Shifts to Attractive Amid Market Volatility
R K Swamy Ltd, a micro-cap player in the Media & Entertainment sector, has witnessed a notable shift in its valuation parameters, moving from a fair to an attractive rating. Despite a recent share price decline of 2.06% to ₹98.53, the company’s price-to-earnings (P/E) and price-to-book value (P/BV) ratios now present a compelling case for investors seeking value in a challenging market environment.
Read full news article Announcements
Compliances-Reg.24(A)-Annual Secretarial Compliance
28-May-2026 | Source : BSESubmission of Annual Secretarial Compliance Report for the financial year ended March 31 2026
Announcement under Regulation 30 (LODR)-Analyst / Investor Meet - Outcome
26-May-2026 | Source : BSESubmission of Transcript of Earnings Conference Call held on Thursday May 21 2026
Announcement under Regulation 30 (LODR)-Analyst / Investor Meet - Outcome
21-May-2026 | Source : BSESubmission of Audio Recording of Earnings Conference Call
Corporate Actions

No Upcoming Board Meetings

R K Swamy Ltd has declared 30% dividend, ex-date: 19 Aug 25

No Splits history available

No Bonus history available

No Rights history available
Quality key factors
Valuation key factors
Technicals key factors
 Technical Indicator Scale: Bearish, Mildly Bearish, Sideways, Mildly Bullish, Bullish Turned
 Shareholding Snapshot : Mar 2026
Shareholding Compare (%holding)
Promoters
None
Held by 1 Schemes (1.78%)
Held by 2 FIIs (0.34%)
Narasimhan K Swamy (32.9%)
Nippon Life India Trustee Ltd-a/c (1.78%)
20.11%
Quarterly Results Snapshot (Consolidated) - Mar'26 - QoQ

QoQ Growth in quarter ended Mar 2026 is 13.78% vs 20.38% in Dec 2025

QoQ Growth in quarter ended Mar 2026 is 479.64% vs 409.26% in Dec 2025
Half Yearly Results Snapshot (Consolidated) - Sep'25
Growth in half year ended Sep 2025 is 12.86% vs -5.04% in Sep 2024
Growth in half year ended Sep 2025 is 26.30% vs -65.95% in Sep 2024
Nine Monthly Results Snapshot (Consolidated) - Dec'25
YoY Growth in nine months ended Dec 2025 is 13.81% vs -1.15% in Dec 2024
YoY Growth in nine months ended Dec 2025 is -2.69% vs -53.28% in Dec 2024
Annual Results Snapshot (Consolidated) - Mar'26
YoY Growth in year ended Mar 2026 is 15.79% vs -11.23% in Mar 2025
YoY Growth in year ended Mar 2026 is 18.49% vs -53.02% in Mar 2025
About R K Swamy Ltd

Company Coordinates


