
Compare R M Drip & Sprin with Similar Stocks
Total Returns (Price + Dividend) 
Latest dividend: 0.028999999999999998 per share ex-dividend date: Sep-08-2025
Risk Adjusted Returns v/s
Returns Beta

News
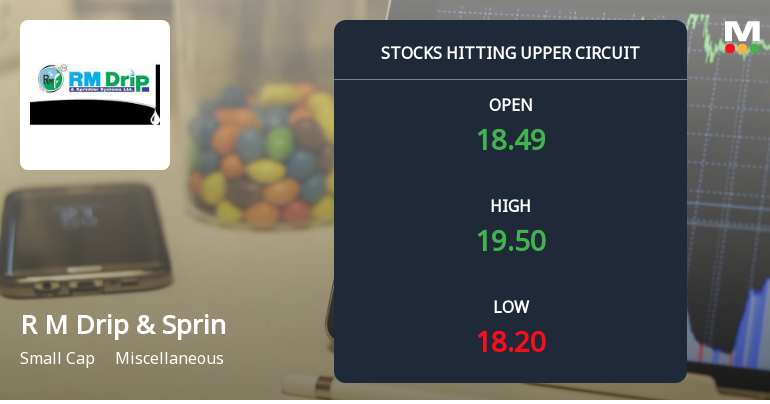
R M Drip & Sprinklers Systems Ltd Locks at Upper Circuit With 4.56% Gain — Buyers Queue, Sellers Absent
At Rs 19.58, the buying was done — not because demand dried up, but because the exchange wouldn't let the stock go any higher. R M Drip & Sprinklers Systems Ltd locked at its upper circuit of 4.56% on 22 Jun 2026, with buyers queuing and no sellers willing to part with shares.
Read full news article
R M Drip & Sprinklers Systems Ltd Faces Bearish Momentum Amid Technical Downgrade
R M Drip & Sprinklers Systems Ltd has experienced a notable shift in its technical momentum, with key indicators signalling a bearish trend. The stock’s recent price action and technical parameters suggest increasing downside pressure, reflecting broader challenges within its sector and market environment.
Read full news article
R M Drip & Sprinklers Systems Ltd is Rated Sell
R M Drip & Sprinklers Systems Ltd is rated Sell by MarketsMOJO. This rating was last updated on 18 May 2026, reflecting a reassessment of the stock’s outlook. However, all fundamentals, returns, and financial metrics discussed here are current as of 21 June 2026, providing investors with the latest perspective on the company’s position.
Read full news article Announcements
Newspaper Advertisement Of Financial Results
03-Jun-2026 | Source : BSEThe Newspaper Publication is enclosed herewith
Results-Financial Results For 31/03/2026
31-May-2026 | Source : BSEDeclaration of Audited Standalone and Consolidated Financial results as on 31st March 2026
Compliances-Reg.24(A)-Annual Secretarial Compliance
30-May-2026 | Source : BSEAnnual Secretarial Report is enclosed herewith
Corporate Actions

No Upcoming Board Meetings

R M Drip & Sprinklers Systems Ltd has declared 5% dividend, ex-date: 08 Sep 25

R M Drip & Sprinklers Systems Ltd has announced 1:10 stock split, ex-date: 26 Sep 25

R M Drip & Sprinklers Systems Ltd has announced 5:7 bonus issue, ex-date: 10 Apr 26

No Rights history available
Quality key factors
Valuation key factors
Technicals key factors
 Technical Indicator Scale: Bearish, Mildly Bearish, Sideways, Mildly Bullish, Bullish Turned
 Shareholding Snapshot : Mar 2026
Shareholding Compare (%holding)
Non Institution
None
Held by 0 Schemes
Held by 6 FIIs (3.85%)
Nivrutti Pandurang Kedar (18.03%)
Kunal Haresh Mehta (12%)
64.0%
Quarterly Results Snapshot (Standalone) - Mar'26 - YoY
Not Applicable: The company has declared_date for only one period
Not Applicable: The company has declared_date for only one period
Half Yearly Results Snapshot (Consolidated) - Sep'25

Growth in half year ended Sep 2025 is -36.13% vs 178.94% in Mar 2025
Growth in half year ended Sep 2025 is -46.07% vs 488.22% in Mar 2025
Nine Monthly Results Snapshot (Consolidated) - Dec'25

YoY Growth in nine months ended Dec 2025 is 64.71% vs 19.20% in Dec 2024
YoY Growth in nine months ended Dec 2025 is 82.47% vs 29.84% in Dec 2024
Annual Results Snapshot (Consolidated) - Mar'26
YoY Growth in year ended Mar 2026 is 50.72% vs 160.51% in Mar 2025
YoY Growth in year ended Mar 2026 is 45.70% vs 343.25% in Mar 2025
About R M Drip & Sprinklers Systems Ltd

Company Coordinates


