
Compare R M Drip & Sprin with Similar Stocks
Total Returns (Price + Dividend) 
Latest dividend: 0.028999999999999998 per share ex-dividend date: Sep-08-2025
Risk Adjusted Returns v/s
Returns Beta

News
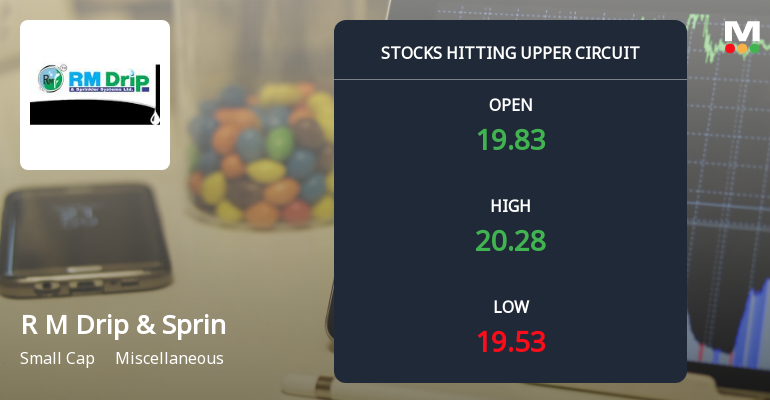
R M Drip & Sprinklers Systems Ltd Locks at Upper Circuit With 5% Gain — Buyers Queue, Sellers Absent
At Rs 20.34, the buying was done — not because demand dried up, but because the exchange wouldn't let the stock go any higher. R M Drip & Sprinklers Systems Ltd locked at its upper circuit of 5% on 25 Jun 2026, with buyers queuing and no sellers willing to part with shares.
Read full news article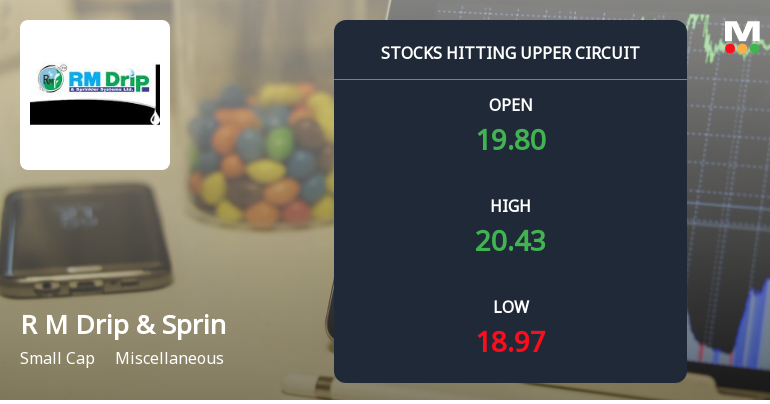
R M Drip & Sprinklers Systems Ltd Locks at Upper Circuit With 2.0% Gain — Buyers Queue, Sellers Absent
At Rs 20.44, the buying was done — not because demand dried up, but because the exchange wouldn't let the stock go any higher. R M Drip & Sprinklers Systems Ltd locked at its upper circuit of 2.0% on 24 Jun 2026, with buyers queuing and no sellers willing to part with shares.
Read full news article
R M Drip & Sprinklers Systems Ltd Sees Mixed Technical Signals Amid Price Momentum Shift
R M Drip & Sprinklers Systems Ltd has experienced a notable shift in its technical momentum, with recent price action and indicator signals painting a complex picture for investors. Despite a 4.99% gain on 23 Jun 2026, the stock remains under pressure from a broader bearish trend, reflected in its MarketsMOJO Sell rating and deteriorating technical grades.
Read full news article Announcements
R M Drip and Sprinklers Systems Limited - Clarification - Financial Results
27-Nov-2019 | Source : NSER M Drip and Sprinklers Systems Limitedprinklers Systems Limited for the quarter ended 30-Sep-2019 with respect to Regulation 33 of the SEBI (Listing Obligations and Disclosure Requirements) Regulations, 2015.
R M Drip and Sprinklers Systems Limited - Press Release
18-Nov-2019 | Source : NSER M Drip and Sprinklers Systems Limited has informed the Exchange regarding a press release dated November 15, 2019, titled "Highlights Turn Around IN H1FY 20".
R M Drip and Sprinklers Systems Limited - Outcome of Board Meeting
14-Nov-2019 | Source : NSER M Drip and Sprinklers Systems Limited has informed the Exchange regarding Board meeting held on November 14, 2019.
Corporate Actions

No Upcoming Board Meetings

R M Drip & Sprinklers Systems Ltd has declared 5% dividend, ex-date: 08 Sep 25

R M Drip & Sprinklers Systems Ltd has announced 1:10 stock split, ex-date: 26 Sep 25

R M Drip & Sprinklers Systems Ltd has announced 5:7 bonus issue, ex-date: 10 Apr 26

No Rights history available
Quality key factors
Valuation key factors
Technicals key factors
 Technical Indicator Scale: Bearish, Mildly Bearish, Sideways, Mildly Bullish, Bullish Turned
 Shareholding Snapshot : Mar 2026
Shareholding Compare (%holding)
Non Institution
None
Held by 0 Schemes
Held by 6 FIIs (3.85%)
Nivrutti Pandurang Kedar (18.03%)
Kunal Haresh Mehta (12%)
64.0%
Quarterly Results Snapshot (Standalone) - Mar'26 - YoY
Not Applicable: The company has declared_date for only one period
Not Applicable: The company has declared_date for only one period
Half Yearly Results Snapshot (Consolidated) - Sep'25

Growth in half year ended Sep 2025 is -36.13% vs 178.94% in Mar 2025
Growth in half year ended Sep 2025 is -46.07% vs 488.22% in Mar 2025
Nine Monthly Results Snapshot (Consolidated) - Dec'25

YoY Growth in nine months ended Dec 2025 is 64.71% vs 19.20% in Dec 2024
YoY Growth in nine months ended Dec 2025 is 82.47% vs 29.84% in Dec 2024
Annual Results Snapshot (Consolidated) - Mar'26
YoY Growth in year ended Mar 2026 is 50.72% vs 160.51% in Mar 2025
YoY Growth in year ended Mar 2026 is 45.70% vs 343.25% in Mar 2025
About R M Drip & Sprinklers Systems Ltd

Company Coordinates


