
Compare R O Jewels with Similar Stocks
Dashboard
With a Operating Losses, the company has a Weak Long Term Fundamental Strength
- Company's ability to service its debt is weak with a poor EBIT to Interest (avg) ratio of 0.58
- The company has been able to generate a Return on Equity (avg) of 7.06% signifying low profitability per unit of shareholders funds
Flat results in Mar 26
Consistent Underperformance against the benchmark over the last 3 years
Stock DNA
Gems, Jewellery And Watches
INR 8 Cr (Micro Cap)
1,214,107,360,145,138,432.00
45
0.00%
0.77
0.00%
0.63
Total Returns (Price + Dividend) 
R O Jewels for the last several years.
Risk Adjusted Returns v/s
Returns Beta

News
Are R O Jewels Ltd latest results good or bad?
R O Jewels Ltd's latest financial results for Q4 FY26 reveal significant operational challenges and a concerning decline in performance. The company reported negative net sales of ₹0.02 crores, marking an unprecedented situation where sales returns or credit adjustments appear to have exceeded actual sales. This represents a stark contrast to the revenue of ₹38.86 crores in the same quarter last year, indicating a severe year-on-year decline. In terms of profitability, R O Jewels recorded a net loss of ₹0.06 crores, which is a notable deterioration from a profit of ₹0.05 crores in Q4 FY25. The operating profit before depreciation, interest, and tax (PBDIT) also turned negative at ₹0.07 crores, reflecting the weakest operational performance in recent quarters. The company's operating margin, while reported at 350%, is distorted due to the negative revenue base, rendering traditional margin analysis ineffect...
Read full news article
R O Jewels Ltd Reports Flat Quarterly Performance Amid Margin Pressures
R O Jewels Ltd, a micro-cap player in the Gems, Jewellery and Watches sector, has reported a flat financial performance for the quarter ended March 2026, marking a significant shift from its previously positive growth trajectory. Key profitability metrics have deteriorated sharply, signalling mounting challenges for the company amid a volatile market environment.
Read full news article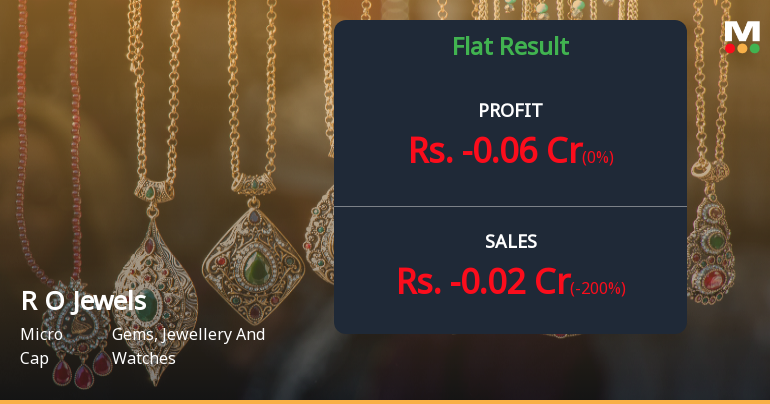
R O Jewels Q4 FY26: Losses Deepen as Revenue Collapses to Negative Territory
R O Jewels Limited, a micro-cap player in the gems and jewellery sector with a market capitalisation of ₹9.00 crores, reported deeply concerning results for Q4 FY26, with the company posting negative revenue and widening losses. Net profit for the March 2026 quarter plunged to a loss of ₹0.06 crores, marking a dramatic deterioration from the ₹0.05 crore profit recorded in Q4 FY25. The stock, trading at ₹1.79 as of June 1, 2026, has declined 0.56% in the latest session and remains down 29.25% over the past year, significantly underperforming its sector benchmark by 43.64 percentage points.
Read full news article Announcements
Announcement under Regulation 30 (LODR)-Change in Management
30-May-2026 | Source : BSEIntimation of change in Secretarial Auditor of the Comoany as attached
Compliances-Reg.24(A)-Annual Secretarial Compliance
30-May-2026 | Source : BSEAnnual Secretarial Compliance Report for the 31st March 2026
Board Meeting Outcome for Declaration Of Audited Financial Results For 31St March 2026
30-May-2026 | Source : BSEAudited Financial Results for the Quater and Financial Year ended 31st March 2026
Corporate Actions

No Upcoming Board Meetings

No Dividend history available

R O Jewels Ltd has announced 2:10 stock split, ex-date: 17 Mar 23

R O Jewels Ltd has announced 82:32 bonus issue, ex-date: 02 Jun 22

No Rights history available
Quality key factors
Valuation key factors
Technicals key factors
 Technical Indicator Scale: Bearish, Mildly Bearish, Sideways, Mildly Bullish, Bullish Turned
 Shareholding Snapshot : Mar 2026
Shareholding Compare (%holding)
Non Institution
None
Held by 0 Schemes
Held by 0 FIIs
Shubham Bharatbhai Shah (0.47%)
Vivid Mercantile Limited (10.74%)
84.6%
Quarterly Results Snapshot (Standalone) - Mar'26 - QoQ

QoQ Growth in quarter ended Mar 2026 is -200.00% vs -99.95% in Dec 2025

QoQ Growth in quarter ended Mar 2026 is 0.00% vs -100.00% in Dec 2025
Half Yearly Results Snapshot (Standalone) - Sep'25
Growth in half year ended Sep 2025 is 638.24% vs -97.82% in Sep 2024
Growth in half year ended Sep 2025 is -50.00% vs -90.84% in Sep 2024
Nine Monthly Results Snapshot (Standalone) - Dec'25
YoY Growth in nine months ended Dec 2025 is 611.78% vs -97.85% in Dec 2024
YoY Growth in nine months ended Dec 2025 is -60.00% vs -90.45% in Dec 2024
Annual Results Snapshot (Standalone) - Mar'26
YoY Growth in year ended Mar 2026 is 3.56% vs -87.58% in Mar 2025
YoY Growth in year ended Mar 2026 is -100.00% vs -81.52% in Mar 2025
About R O Jewels Ltd

Company Coordinates


