
Compare R S Software (I) with Similar Stocks
Dashboard
With a Operating Losses, the company has a Weak Long Term Fundamental Strength
- Company's ability to service its debt is weak with a poor EBIT to Interest (avg) ratio of -6.17
The company has declared negative results for the last 6 consecutive quarters
Risky - Negative EBITDA
Below par performance in long term as well as near term
Stock DNA
Computers - Software & Consulting
INR 87 Cr (Micro Cap)
NA (Loss Making)
20
0.00%
0.31
-99.45%
2.98
Total Returns (Price + Dividend) 
Latest dividend: 0.25 per share ex-dividend date: Jul-19-2024
Risk Adjusted Returns v/s
Returns Beta

News

R S Software (India) Ltd is Rated Strong Sell
R S Software (India) Ltd is rated Strong Sell by MarketsMOJO. This rating was last updated on 21 Jan 2025. However, the analysis and financial metrics discussed below reflect the company’s current position as of 20 July 2026, providing investors with an up-to-date view of the stock’s fundamentals, returns, and technical outlook.
Read full news articleWhen is the next results date for R S Software (India) Ltd?
The next results date for R S Software (India) Ltd is scheduled for 22 July 2026....
Read full news article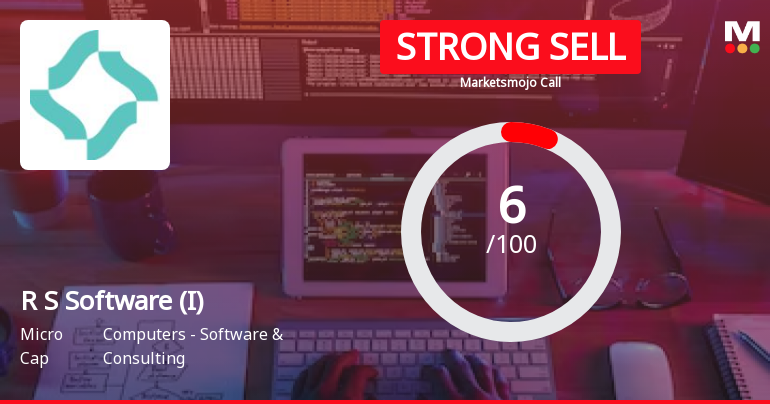
R S Software (India) Ltd is Rated Strong Sell
R S Software (India) Ltd is rated Strong Sell by MarketsMOJO, with this rating last updated on 21 Jan 2025. However, the analysis and financial metrics discussed here reflect the company’s current position as of 09 July 2026, providing investors with an up-to-date view of its fundamentals, valuation, financial trends, and technical outlook.
Read full news article Announcements
R. S. Software (India) Limited - Updates
01-Nov-2019 | Source : NSER. S. Software (India) Limited has informed the Exchange regarding 'We refer to the Company s letter dated October 29, 2019 on the subject matter.
Clarification - Financial Results
14-Aug-2019 | Source : NSE
| The Exchange has sought clarification from R. S. Software (India) Limited for the quarter ended 30-Jun-2019 with respect to Regulation 33 of the SEBI (Listing Obligations and Disclosure Requirements) Regulations, 2015. On basis of above the Company is required to clarify the following: -1. Limited Review Report/ Independent Auditor's Report is not in the format prescribed by SEBI The response of the Company is awaited. |
Updates
29-Jul-2019 | Source : NSE
| R. S. Software (India) Limited has informed the Exchange regarding 'We are submitting the copies of paper cutting of advertisement of the Audited Financial Results of the Company for the period ending June 30, 2019, which has published in the ??Business Standard?? (all India edition in English) and in ??Eisomoye?? (in Vernacular) on July 26, 2019. '. |
Corporate Actions

22 Jul 2026

R S Software (India) Ltd has declared 5% dividend, ex-date: 19 Jul 24

R S Software (India) Ltd has announced 5:10 stock split, ex-date: 21 Jan 15

R S Software (India) Ltd has announced 28:100 bonus issue, ex-date: 21 Jun 10

R S Software (India) Ltd has announced 1:2 rights issue, ex-date: 27 Sep 06
Quality key factors
Valuation key factors
Technicals key factors
 Technical Indicator Scale: Bearish, Mildly Bearish, Sideways, Mildly Bullish, Bullish Turned
 Shareholding Snapshot : Jun 2026
Shareholding Compare (%holding)
Non Institution
None
Held by 2 Schemes (0.01%)
Held by 2 FIIs (0.78%)
Rajnit Rai Jain (39.46%)
R Ramaraj (1.4%)
48.65%
Quarterly Results Snapshot (Consolidated) - Mar'26 - QoQ

QoQ Growth in quarter ended Mar 2026 is 11.21% vs -11.86% in Dec 2025
QoQ Growth in quarter ended Mar 2026 is -32.27% vs -42.40% in Dec 2025
Half Yearly Results Snapshot (Consolidated) - Sep'25

Growth in half year ended Sep 2025 is -61.51% vs 63.38% in Sep 2024
Growth in half year ended Sep 2025 is -199.37% vs 177.17% in Sep 2024
Nine Monthly Results Snapshot (Consolidated) - Dec'25
YoY Growth in nine months ended Dec 2025 is -60.55% vs 17.74% in Dec 2024
YoY Growth in nine months ended Dec 2025 is -260.50% vs -1.24% in Dec 2024
Annual Results Snapshot (Consolidated) - Mar'26
YoY Growth in year ended Mar 2026 is -56.14% vs -3.73% in Mar 2025
YoY Growth in year ended Mar 2026 is -433.45% vs -51.79% in Mar 2025
About R S Software (India) Ltd

Company Coordinates


