R Systems Intl.

  • Market Cap: Small Cap
  • Industry: Computers - Software & Consulting
  • ISIN: INE411H01032
  • NSEID: RSYSTEMS
  • BSEID: 532735
INR
269.25
-1.4 (-0.52%)
BSENSE

May 22

BSE+NSE Vol: 1.12 lacs

  • Price Points
  • Score
  • Mojo Parameters
  • Total Return
  • News and Corporate Actions
  • Key factors
  • Shareholding
  • Financials
  • CompanyCV
stock-summaryPrice Point
High/Low

1Day

52 Week

Valuation
Technical
Day's Volume

CASH

1.12 lacs (-43.07%) Volume

Shareholding (May 2026)

FII

3.88%

Held by 44 FIIs

DII

7.20%

Held by 5 DIIs

Promoter

51.85%

What does R Systems Intl. do?

06-Jun-2025

R Systems International Ltd is a Small Cap company in the Computers - Software & Consulting industry, reporting net sales of 442 Cr and a net profit of 39 Cr for March 2025. It has a market cap of Rs 4,549 Cr, a P/E ratio of 31.00, and a dividend yield of 3.39%.

Overview:<BR>R Systems International Ltd operates in the Computers - Software & Consulting industry and is categorized as a Small Cap company.<BR><BR>History:<BR>The company was incorporated in 1993 as a Private Limited Company and underwent several status changes, becoming a Public Limited Company in 2000. The latest quarterly results reported net sales and net profit for March 2025.<BR><BR>Financial Snapshot:<BR>Most recent Net Sales: 442 Cr (Quarterly Results - Mar 2025) <BR>Most recent Net Profit: 39 Cr (Quarterly Results - Mar 2025) <BR>Market-cap value: Rs 4,549 Cr (Small Cap)<BR><BR>Key Metrics:<BR>P/E: 31.00 <BR>Industry P/E: 29 <BR>Dividend Yield: 3.39% <BR>Debt Equity: -0.19 <BR>Return on Equity: 21.02% <BR>Price to Book: 6.99 <BR><BR>Contact Details:<BR>Address: GF-1-A 6 Devika Tower, Nehru Place New Delhi New Delhi : 110019 <BR>Tel: 91-011-32596619 <BR>Email: rsil@rsystems.com <BR>Website: http://www.rsystems.com

View full answer

Who are in the management team of R Systems Intl.?

06-Jun-2025

As of December 2021, the management team of R Systems International includes Ruchica Gupta, Aditya Wadhwa, and Kapil Dhameja as Independent Directors, along with Bhasker Dubey (Company Secretary), Amit Dalmia, Mukesh Mehta, and Animesh Agrawal as Non-Executive Directors.

As of December 2021, the management team of R Systems International includes the following individuals:<BR><BR>1. Ruchica Gupta - Independent Director<BR>2. Aditya Wadhwa - Independent Director<BR>3. Kapil Dhameja - Independent Director<BR>4. Bhasker Dubey - Company Secretary & Compliance Officer<BR>5. Amit Dalmia - Non-Executive Director<BR>6. Mukesh Mehta - Non-Executive Director<BR>7. Animesh Agrawal - Non-Executive Director<BR><BR>These members contribute to the governance and oversight of the company.

View full answer

Has R Systems Intl. declared dividend?

06-Jun-2025

R Systems International Ltd has declared a 600% dividend, amounting to ₹6 per share, with an ex-date of May 14, 2025. While recent returns have been negative, longer-term performance shows significant growth, with a total return of 328.74% over the past five years.

R Systems International Ltd has declared a 600% dividend.<BR><BR>Dividend Details:<BR>- Percentage announced: 600%<BR>- Amount per share: 6<BR>- Ex-date: May 14, 2025<BR><BR>Dividend Yield: 3.39%.<BR><BR>Total Returns by Period:<BR>Over the 6-month period, the price return was -22.97%, the dividend return was 1.23%, resulting in a total return of -21.74%.<BR><BR>For the 1-year period, the price return was -13.13%, the dividend return was 2.66%, leading to a total return of -10.47%.<BR><BR>In the 2-year period, the price return was 14.03%, the dividend return was 6.26%, culminating in a total return of 20.29%.<BR><BR>During the 3-year period, the price return was 66.97%, the dividend return was 11.53%, resulting in a total return of 78.5%.<BR><BR>Over the 4-year period, the price return was 186.45%, the dividend return was 24.04%, leading to a total return of 210.49%.<BR><BR>In the 5-year period, the price return was 289.32%, the dividend return was 39.42%, culminating in a total return of 328.74%.<BR><BR>Overall, R Systems International Ltd has declared a significant dividend, and while recent returns over shorter periods have been negative, longer-term returns show substantial growth, indicating a potentially strong investment performance over time.

View full answer

Who are the peers of the R Systems Intl.?

03-Jun-2025

R Systems Intl.'s peers include TCS, Infosys, HCL Technologies, Wipro, Tech Mahindra, Network People, Protean eGov, 63 Moons Tech., Datamatics Glob., and Genesys Intl. R Systems Intl. has a 1-year return of -15.33%, the lowest among its peers, while 63 Moons Tech. leads with a return of 141.27%.

Peers: The peers of R Systems Intl. are TCS, Infosys, HCL Technologies, Wipro, Tech Mahindra, Network People, Protean eGov, 63 Moons Tech., Datamatics Glob., and Genesys Intl.<BR><BR>Quality Snapshot: Excellent management risk is observed at TCS, Infosys, HCL Technologies, and R Systems Intl., while Good management risk is found at Wipro and Tech Mahindra. Average management risk is noted at Network People, Protean eGov, 63 Moons Tech., Datamatics Glob., and Genesys Intl. Growth is rated as Good for TCS, Infosys, R Systems Intl., and the rest have ratings of Average or Below Average. Capital Structure is rated Excellent for TCS, Infosys, HCL Technologies, Wipro, Tech Mahindra, R Systems Intl., Network People, and Datamatics Glob., while the rest have Below Average ratings.<BR><BR>Return Snapshot: The peer with the highest 1-year return is 63 Moons Tech. at 141.27%, while R Systems Intl. has a 1-year return of -15.33%, indicating a significantly lower performance compared to its peers. The peer with the lowest 1-year return is R Systems Intl. at -15.33%, and several peers, including Wipro, Tech Mahindra, Protean eGov, and Genesys Intl., have negative six-month returns.

View full answer

Who are the top shareholders of the R Systems Intl.?

17-Jul-2025

The top shareholders of R Systems International are Bcp Asia II Topco II Pte Ltd with 51.9%, followed by public shareholder Bhavook Tripathi at 20.54%. Mutual funds hold 4.25%, foreign institutional investors hold 3.97%, and individual investors collectively own 10.28%.

The top shareholders of R Systems International include the promoters, with Bcp Asia II Topco II Pte Ltd holding the largest share at 51.9%. Additionally, Bhavook Tripathi is the highest public shareholder, owning 20.54%. The company also has mutual funds holding 4.25% across three schemes and foreign institutional investors (FIIs) holding 3.97% through 45 different entities. Individual investors collectively hold 10.28% of the shares.

View full answer

How big is R Systems Intl.?

24-Jul-2025

As of 24th July, R Systems International Ltd has a market capitalization of 5,194.00 Cr, with recent net sales of 1,767.56 Cr and a net profit of 142.28 Cr. The balance sheet for December 2024 shows shareholder's funds of 624.05 Cr and total assets of 1,176.38 Cr.

As of 24th July, R Systems International Ltd has a market capitalization of 5,194.00 Cr, categorizing it as a Mid Cap company.<BR><BR>For the latest four quarters, R Systems reported Net Sales of 1,767.56 Cr and a Net Profit of 142.28 Cr.<BR><BR>The latest reporting period for the balance sheet is December 2024, showing Shareholder's Funds of 624.05 Cr and Total Assets of 1,176.38 Cr.

View full answer

Is R Systems Intl. overvalued or undervalued?

11-Nov-2025

As of November 10, 2025, R Systems International is fairly valued with a PE ratio of 26.43, an EV to EBITDA of 17.18, and a PEG ratio of 0.72, but it trades at a premium compared to peers like TCS and Infosys, and has underperformed the Sensex with a return of -12.20% over the past year.

As of 10 November 2025, the valuation grade for R Systems International has moved from attractive to fair. The company is currently fairly valued based on its financial metrics. Key ratios include a PE ratio of 26.43, an EV to EBITDA of 17.18, and a PEG ratio of 0.72, which suggests that the stock may be reasonably priced relative to its growth prospects.<BR><BR>In comparison to its peers, TCS has a more attractive PE ratio of 21.77, while Infosys has a PE of 22.37, indicating that R Systems International is trading at a premium relative to these companies. Additionally, HCL Technologies, with a PE of 24.63, also highlights that R Systems is not the most competitively priced in its sector. Notably, the company's stock has underperformed the Sensex over the past year, with a return of -12.20% compared to the Sensex's 5.09%, reinforcing the view that it is fairly valued at this time.

View full answer

How has been the historical performance of R Systems Intl.?

04-Dec-2025

R Systems Intl. has shown consistent growth in net sales and operating profit from INR 809.38 crore in December 2019 to INR 1,741.73 crore in December 2024, although profit after tax declined slightly from INR 140.61 crore in December 2023 to INR 131.18 crore in December 2024. Total assets and cash flow from operating activities have also significantly improved during this period.

Answer:<BR>The historical performance of R Systems Intl. shows a consistent growth in net sales and operating profit over the years, with a slight decline in profit after tax in the most recent year.<BR><BR>Breakdown:<BR>R Systems Intl. has demonstrated a steady increase in net sales from INR 809.38 crore in December 2019 to INR 1,741.73 crore in December 2024. The total operating income has followed a similar upward trend, reaching INR 1,741.73 crore in December 2024, up from INR 809.38 crore in December 2019. Operating profit, excluding other income, has also improved, rising from INR 73.01 crore in December 2019 to INR 256.96 crore in December 2024. However, profit before tax peaked at INR 200.52 crore in December 2023 and slightly decreased to INR 191.50 crore in December 2024. Profit after tax has shown a decline from INR 140.61 crore in December 2023 to INR 131.18 crore in December 2024. The company's total assets increased from INR 486.60 crore in December 2019 to INR 1,176.38 crore in December 2024, while total liabilities rose from INR 486.60 crore to INR 1,176.38 crore in the same period. Cash flow from operating activities has improved significantly, reaching INR 235 crore in December 2024, compared to INR 64 crore in December 2019. Overall, R Systems Intl. has shown robust growth in revenue and operating profit, despite a recent dip in net profit.

View full answer

Is R Systems Intl. technically bullish or bearish?

05-Dec-2025

As of December 4, 2025, the stock trend has shifted to mildly bullish with a current price of 420.95, reflecting a 6.22% short-term gain despite a year-to-date decline of 9.57%, while maintaining a strong long-term outlook with a 5-year return of 258.71%.

As of 4 December 2025, the technical trend has changed from sideways to mildly bullish. The current price of 420.95 shows an increase from the previous close of 405.55, indicating positive momentum. The stock has performed well in the short term, with a 1-week return of 6.22%, contrasting with a slight decline in the Sensex. Although the year-to-date performance is down 9.57%, the longer-term outlook remains strong with a 5-year return of 258.71%. Key indicators driving this mildly bullish stance include the recent price increase and the positive short-term return relative to the market.

View full answer

When is the next results date for R Systems International Ltd?

29-Apr-2026

The next results date for R Systems International Ltd is 06 May 2026.

The next results date for R Systems International Ltd is scheduled for 06 May 2026.

View full answer

Are R Systems International Ltd latest results good or bad?

07-May-2026

R Systems International Ltd's latest results show strong net profit and revenue growth, with a 79.65% QoQ increase in net profit and 29.90% YoY revenue growth. However, concerns arise from slowing revenue growth, rising interest costs, and reliance on exceptional income, suggesting investors should proceed with caution.

R Systems International Ltd's latest results present a mixed picture. On one hand, the company reported a significant increase in net profit for Q4 FY26, rising by 79.65% quarter-on-quarter (QoQ) to ₹65.41 crore, and a 69.50% increase year-on-year (YoY). Revenue also showed a positive trend, reaching ₹574.77 crore, which is a 3.54% increase QoQ and a robust 29.90% YoY growth.<BR><BR>However, there are notable concerns. The sequential revenue growth of 3.54% marks a significant deceleration from the previous quarter's 11.33%, indicating potential demand challenges. Additionally, while operating margins improved to 17.50%, this was accompanied by a sharp increase in interest costs, which surged to ₹9.59 crore, leading to a decline in the interest coverage ratio to 10.49 times—the lowest in recent quarters.<BR><BR>Moreover, the substantial rise in other income to ₹20.15 crore raises questions about the sustainability of the reported profit figures, as this was a significant jump from just ₹2.98 crore in the prior quarter. This reliance on exceptional items for profit could signal underlying weaknesses in operational performance.<BR><BR>In summary, while the headline figures for net profit and revenue growth appear strong, the deceleration in revenue growth, rising interest costs, and concerns over earnings quality suggest caution. Investors may want to monitor the company's performance closely in the coming quarters to assess whether these trends continue.

View full answer

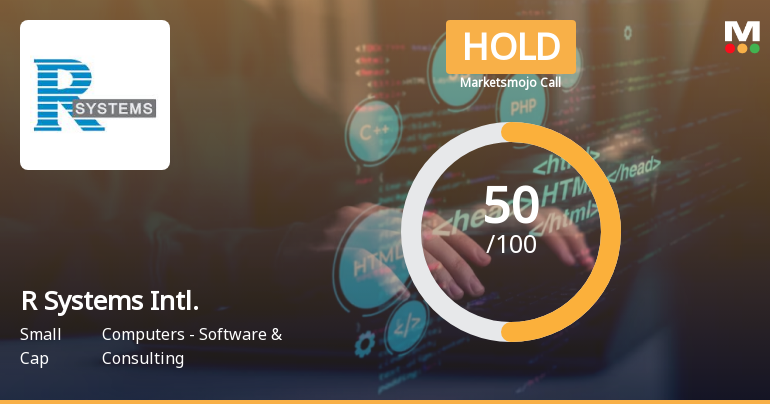
Should I buy, sell or hold R Systems International Ltd?

20-May-2026

Why is R Systems International Ltd falling/rising?

24-May-2026

As of 24-May, R Systems International Ltd's stock price is at 269.25, reflecting a decline of 1.4 or 0.52%. The stock has been on a downward trend, underperforming against the Sensex, and is trading below its moving averages, indicating a bearish outlook.

As of 24-May, R Systems International Ltd's stock price is falling, currently at 269.25, reflecting a decrease of 1.4 or 0.52%. The stock has been on a downward trend, having lost value for the last three consecutive days, with a total decline of 3.49% during this period. <BR><BR>In terms of performance relative to the broader market, the stock has underperformed against the Sensex, which has gained 0.24% over the past week, while R Systems has decreased by 1.45%. Over the past month, the stock has fallen by 6.77%, compared to a smaller decline of 3.95% in the Sensex. Year-to-date, the stock is down 33.28%, significantly worse than the Sensex's decline of 11.51%. <BR><BR>Additionally, the stock is trading below its moving averages across various time frames, including the 5-day, 20-day, 50-day, 100-day, and 200-day averages, indicating a bearish trend. Investor participation has also decreased, with delivery volume dropping by 57.44% compared to the 5-day average, suggesting reduced interest in the stock. <BR><BR>Despite some positive factors, such as high management efficiency and attractive valuation metrics, the overall performance and recent trends indicate that the stock is currently in a falling phase.

View full answer
iScoreScore
Click here to find our call on this stock
Strong Sell
Sell
Hold
Buy
Strong Buy

Dashboard

1

High Management Efficiency with a high ROE of 25.25%

 
2

Company has a Debt to Equity ratio (avg) of 0.02 times

 
3

Flat results in Mar 26

4

With ROCE of 27, it has a Attractive valuation with a 3.7 Enterprise value to Capital Employed

5

Below par performance in long term as well as near term

stock-summaryMojo Parameters

Mojo Parameters

Loading Valuation Snapshot...

Stock DNA

stock-summary
Industry

Computers - Software & Consulting

stock-summary
Market cap

INR 3,191 Cr (Small Cap)

stock-summary
P/E

14.00

stock-summary
Industry P/E

21

stock-summary
Dividend Yield

2.21%

stock-summary
Debt Equity

0.12

stock-summary
Return on Equity

25.99%

stock-summary
Price to Book

4.06

Revenue and Profits:
Net Sales:
575 Cr
(Quarterly Results - Mar 2026)
Net Profit:
65 Cr
stock-summaryTotal Returns
Total Returns (Price + Dividend) stock-summary
Dividend Yield (2.21%)
TimePeriod
Price Return
Dividend Return
Total Return
3 Months
-12.48%
2.04%
-10.44%
6 Months
-33.14%
1.49%
-31.65%
1 Year
-28.1%
1.64%
-26.46%
2 Years
-43.88%
4.29%
-39.59%
3 Years
10.24%
8.12%
18.36%
4 Years
17.76%
14.21%
31.97%
5 Years
97.47%
30.94%
128.41%

Latest dividend: 6 per share ex-dividend date: Mar-12-2026

Risk Adjusted Returns v/s stock-summary
Returns Beta
Icon
Beta has not been calculated since enough price history is not available
stock-summaryNews & Corporate Actions

News

R Systems International Ltd Declines 1.45% Amid Mixed Technicals and Valuation Shifts

Announcements stock-summary

INTIMATION UNDER REGULATION 30 OF THE SEBI (LISTING OBLIGATIONS AND DISCLOSURE REQUIREMENTS) REGULATIONS 2015; RECEIPT OF UNSOLICITED ESG RATING

21-May-2026 | Source : BSE

As enclosed.

Announcement under Regulation 30 (LODR)-Newspaper Publication

16-May-2026 | Source : BSE

Newspaper Advertisement regarding the reminder notice to the shareholders on the special window for re-lodgement of transfer requests of physical shares

Announcement under Regulation 30 (LODR)-Earnings Call Transcript

13-May-2026 | Source : BSE

As enclosed.

Corporate Actions stock-summary

stock-summary
BOARD MEETING

No Upcoming Board Meetings

stock-summary
DIVIDEND

R Systems International Ltd has declared 600% dividend, ex-date: 12 Mar 26

stock-summary
SPLITS

R Systems International Ltd has announced 1:10 stock split, ex-date: 26 Feb 14

stock-summary
BONUS

No Bonus history available

stock-summary
RIGHTS

No Rights history available

stock-summaryKey Factors

Quality key factors stock-summary

Factor
Value
Sales Growth (5y)
17.87%
EBIT Growth (5y)
20.89%
EBIT to Interest (avg)
24.45
Debt to EBITDA (avg)
0.49
Net Debt to Equity (avg)
0.12
Sales to Capital Employed (avg)
2.32
Tax Ratio
26.06%
Dividend Payout Ratio
57.42%
Pledged Shares
0
Institutional Holding
11.08%
ROCE (avg)
42.65%
ROE (avg)
25.25%

Valuation key factors

Factor
Value
P/E Ratio
14
Industry P/E
21
Price to Book Value
4.03
EV to EBIT
12.50
EV to EBITDA
9.78
EV to Capital Employed
3.71
EV to Sales
1.57
PEG Ratio
0.22
Dividend Yield
2.23%
ROCE (Latest)
27.04%
ROE (Latest)
25.99%

Technicals key factors

Indicator
Weekly
Monthly
MACD
Mildly Bullish
Bearish
RSI
No Signal
No Signal
Bollinger Bands
Bearish
Mildly Bearish
Moving Averages
Bearish (Daily)
KST
Mildly Bullish
Bearish
Dow Theory
Mildly Bullish
Mildly Bearish
OBV
No Trend
Mildly Bearish
stock-summary Technical Indicator Scale: Bearish, Mildly Bearish, Sideways, Mildly Bullish, Bullish  Turned 
stock-summaryShareholding
Shareholding Snapshot : May 2026stock-summary
Shareholding Compare (%holding) stock-summary
Majority shareholders

Promoters

Pledged Promoter Holdings

None

Mutual Funds

Held by 3 Schemes (3.94%)

FIIs

Held by 44 FIIs (3.88%)

Promoter with highest holding

Bcp Asia Ii Topco Ii Pte Ltd (51.85%)

Highest Public shareholder

Bhavook Tripathi (20.47%)

Individual Investors Holdings

11.97%

stock-summaryFinancial
[
  {
    "link": "quarterly",
    "btn_text": "All Quarterly Results",
    "header": "Quarterly Results Snapshot (Consolidated) - Mar'26 - QoQ",
    "rhs": [
      {
        "prefix": "Net Sales ",
        "suffix": "QoQ Growth in quarter ended Mar 2026 is 3.54% vs 11.33% in Dec 2025",
        "dir": -1
      },
      {
        "prefix": "Consolidated Net Profit ",
        "suffix": "QoQ Growth in quarter ended Mar 2026 is 79.65% vs 3.03% in Dec 2025",
        "dir": 1
      }
    ],
    "table": {
      "header": [
        "Mar'26",
        "Dec'25",
        "Change(%)"
      ],
      "body": [
        {
          "field": "Net Sales",
          "val1": "574.77",
          "val2": "555.11",
          "chgp": "3.54%",
          "chgp_class": "positive"
        },
        {
          "field": "Operating Profit (PBDIT) excl Other Income",
          "val1": "100.58",
          "val2": "93.53",
          "chgp": "7.54%",
          "chgp_class": "positive"
        },
        {
          "field": "Interest",
          "val1": "9.59",
          "val2": "6.82",
          "chgp": "40.62%",
          "chgp_class": "negative"
        },
        {
          "field": "Exceptional Items",
          "val1": "0.00",
          "val2": "-24.58",
          "chgp": "100.00%",
          "chgp_class": "positive"
        },
        {
          "field": "Consolidate Net Profit",
          "val1": "65.41",
          "val2": "36.41",
          "chgp": "79.65%",
          "chgp_class": "positive"
        },
        {
          "field": "Operating Profit Margin (Excl OI)",
          "val1": "17.50%",
          "val2": "16.85%",
          "chgp": "0.65%",
          "chgp_class": "positive"
        }
      ]
    }
  },
  {
    "link": "half-yearly",
    "btn_text": "All Half Yearly Results",
    "header": "Half Yearly Results Snapshot (Consolidated) - Jun'25",
    "rhs": [
      {
        "prefix": "Net Sales ",
        "suffix": " Growth in half year ended Jun 2025 is 6.57% vs 4.67% in Jun 2024",
        "dir": 1
      },
      {
        "prefix": "Consolidated Net Profit ",
        "suffix": " Growth in half year ended Jun 2025 is 118.54% vs 4.20% in Jun 2024",
        "dir": 1
      }
    ],
    "table": {
      "header": [
        "Jun'25",
        "Jun'24",
        "Change(%)"
      ],
      "body": [
        {
          "field": "Net Sales",
          "val1": "904.48",
          "val2": "848.68",
          "chgp": "6.57%",
          "chgp_class": "positive"
        },
        {
          "field": "Operating Profit (PBDIT) excl Other Income",
          "val1": "140.74",
          "val2": "115.14",
          "chgp": "22.23%",
          "chgp_class": "positive"
        },
        {
          "field": "Interest",
          "val1": "3.63",
          "val2": "4.85",
          "chgp": "-25.15%",
          "chgp_class": "positive"
        },
        {
          "field": "Exceptional Items",
          "val1": "0.00",
          "val2": "0.00",
          "chgp": "",
          "chgp_class": "neutral"
        },
        {
          "field": "Consolidate Net Profit",
          "val1": "114.45",
          "val2": "52.37",
          "chgp": "118.54%",
          "chgp_class": "positive"
        },
        {
          "field": "Operating Profit Margin (Excl OI)",
          "val1": "15.56%",
          "val2": "13.57%",
          "chgp": "1.99%",
          "chgp_class": "positive"
        }
      ]
    }
  },
  {
    "link": "nine-monthly",
    "btn_text": "All Nine Monthly Results",
    "header": "Nine Monthly Results Snapshot (Consolidated) - Sep'25",
    "rhs": [
      {
        "prefix": "Net Sales ",
        "suffix": "YoY Growth in nine months ended Sep 2025 is 8.53% vs 1.94% in Sep 2024",
        "dir": 1
      },
      {
        "prefix": "Consolidated Net Profit ",
        "suffix": "YoY Growth in nine months ended Sep 2025 is 62.50% vs -2.19% in Sep 2024",
        "dir": 1
      }
    ],
    "table": {
      "header": [
        "Sep'25",
        "Sep'24",
        "Change(%)"
      ],
      "body": [
        {
          "field": "Net Sales",
          "val1": "1,403.10",
          "val2": "1,292.77",
          "chgp": "8.53%",
          "chgp_class": "positive"
        },
        {
          "field": "Operating Profit (PBDIT) excl Other Income",
          "val1": "212.82",
          "val2": "183.40",
          "chgp": "16.04%",
          "chgp_class": "positive"
        },
        {
          "field": "Interest",
          "val1": "7.35",
          "val2": "6.46",
          "chgp": "13.78%",
          "chgp_class": "negative"
        },
        {
          "field": "Exceptional Items",
          "val1": "0.00",
          "val2": "0.00",
          "chgp": "",
          "chgp_class": "neutral"
        },
        {
          "field": "Consolidate Net Profit",
          "val1": "149.79",
          "val2": "92.18",
          "chgp": "62.50%",
          "chgp_class": "positive"
        },
        {
          "field": "Operating Profit Margin (Excl OI)",
          "val1": "15.17%",
          "val2": "14.19%",
          "chgp": "0.98%",
          "chgp_class": "positive"
        }
      ]
    }
  },
  {
    "link": "annual",
    "btn_text": "All Annual Results",
    "header": "Annual Results Snapshot (Consolidated) - Dec'25",
    "rhs": [
      {
        "prefix": "Net Sales ",
        "suffix": "YoY Growth in year ended Dec 2025 is 12.43% vs 3.40% in Dec 2024",
        "dir": 1
      },
      {
        "prefix": "Consolidated Net Profit ",
        "suffix": "YoY Growth in year ended Dec 2025 is 41.94% vs -6.37% in Dec 2024",
        "dir": 1
      }
    ],
    "table": {
      "header": [
        "Dec'25",
        "Dec'24",
        "Change(%)"
      ],
      "body": [
        {
          "field": "Net Sales",
          "val1": "1,958.21",
          "val2": "1,741.73",
          "chgp": "12.43%",
          "chgp_class": "positive"
        },
        {
          "field": "Operating Profit (PBDIT) excl Other Income",
          "val1": "306.72",
          "val2": "256.96",
          "chgp": "19.36%",
          "chgp_class": "positive"
        },
        {
          "field": "Interest",
          "val1": "14.17",
          "val2": "8.40",
          "chgp": "68.69%",
          "chgp_class": "negative"
        },
        {
          "field": "Exceptional Items",
          "val1": "-24.58",
          "val2": "0.00",
          "chgp": "",
          "chgp_class": "neutral"
        },
        {
          "field": "Consolidate Net Profit",
          "val1": "186.20",
          "val2": "131.18",
          "chgp": "41.94%",
          "chgp_class": "positive"
        },
        {
          "field": "Operating Profit Margin (Excl OI)",
          "val1": "15.66%",
          "val2": "14.75%",
          "chgp": "0.91%",
          "chgp_class": "positive"
        }
      ]
    }
  }
]

Quarterly Results Snapshot (Consolidated) - Mar'26 - QoQstock-summary

Mar'26
Dec'25
Change(%)
Net Sales
574.77
555.11
3.54%
Operating Profit (PBDIT) excl Other Income
100.58
93.53
7.54%
Interest
9.59
6.82
40.62%
Exceptional Items
0.00
-24.58
100.00%
Consolidate Net Profit
65.41
36.41
79.65%
Operating Profit Margin (Excl OI)
17.50%
16.85%
0.65%
Values in Rs Cr.
Direction Arrows
Net Sales

QoQ Growth in quarter ended Mar 2026 is 3.54% vs 11.33% in Dec 2025

Direction Arrows
Consolidated Net Profit

QoQ Growth in quarter ended Mar 2026 is 79.65% vs 3.03% in Dec 2025

Half Yearly Results Snapshot (Consolidated) - Jun'25stock-summary

Jun'25
Jun'24
Change(%)
Net Sales
904.48
848.68
6.57%
Operating Profit (PBDIT) excl Other Income
140.74
115.14
22.23%
Interest
3.63
4.85
-25.15%
Exceptional Items
0.00
0.00
Consolidate Net Profit
114.45
52.37
118.54%
Operating Profit Margin (Excl OI)
15.56%
13.57%
1.99%
Values in Rs Cr.
Direction Arrows
Net Sales

Growth in half year ended Jun 2025 is 6.57% vs 4.67% in Jun 2024

Direction Arrows
Consolidated Net Profit

Growth in half year ended Jun 2025 is 118.54% vs 4.20% in Jun 2024

Nine Monthly Results Snapshot (Consolidated) - Sep'25stock-summary

Sep'25
Sep'24
Change(%)
Net Sales
1,403.10
1,292.77
8.53%
Operating Profit (PBDIT) excl Other Income
212.82
183.40
16.04%
Interest
7.35
6.46
13.78%
Exceptional Items
0.00
0.00
Consolidate Net Profit
149.79
92.18
62.50%
Operating Profit Margin (Excl OI)
15.17%
14.19%
0.98%
Values in Rs Cr.
Direction Arrows
Net Sales

YoY Growth in nine months ended Sep 2025 is 8.53% vs 1.94% in Sep 2024

Direction Arrows
Consolidated Net Profit

YoY Growth in nine months ended Sep 2025 is 62.50% vs -2.19% in Sep 2024

Annual Results Snapshot (Consolidated) - Dec'25stock-summary

Dec'25
Dec'24
Change(%)
Net Sales
1,958.21
1,741.73
12.43%
Operating Profit (PBDIT) excl Other Income
306.72
256.96
19.36%
Interest
14.17
8.40
68.69%
Exceptional Items
-24.58
0.00
Consolidate Net Profit
186.20
131.18
41.94%
Operating Profit Margin (Excl OI)
15.66%
14.75%
0.91%
Values in Rs Cr.
Direction Arrows
Net Sales

YoY Growth in year ended Dec 2025 is 12.43% vs 3.40% in Dec 2024

Direction Arrows
Consolidated Net Profit

YoY Growth in year ended Dec 2025 is 41.94% vs -6.37% in Dec 2024

stock-summaryCompany CV
About R Systems International Ltd stock-summary
stock-summary
R Systems International Ltd
Small Cap
Computers - Software & Consulting
R Systems International Limited was formerly incorporated on May 14, 1993 as a Private Limited Company with the name 'R Systems (India) Pvt Ltd' Later, on March 14, 2000, the Company converted into a Public Limited Company and the name was changed to R Systems (India) Limited. Further, on July 25, 2000, the Company changed their name from 'R Systems (India) Limited' to 'R Systems International Limited'. The Company is originally promoted by Satinder Singh Rekhi and Gurjot Singh Uberoi.
Company Coordinates stock-summary
Company Details
GF-1-A 6 Devika Tower, Nehru Place New Delhi New Delhi : 110019
stock-summary
Tel: 91-011-32596619
stock-summary
rsil@rsystems.com
Registrar Details
Link Intime India Pvt Ltd., Narang Tower 44, Community Centre, Naraina Industrial Area , Phase - 1, New Delhi