
Compare Race Eco with Similar Stocks
Dashboard
Poor Management Efficiency with a low ROCE of 7.58%
- The company has been able to generate a Return on Capital Employed (avg) of 7.58% signifying low profitability per unit of total capital (equity and debt)
Low ability to service debt as the company has a high Debt to EBITDA ratio of 6.34 times
Flat results in Mar 26
Falling Participation by Institutional Investors
Below par performance in long term as well as near term
Total Returns (Price + Dividend) 
Race Eco for the last several years.
Risk Adjusted Returns v/s
Returns Beta

News

Race Eco Chain Ltd is Rated Sell
Race Eco Chain Ltd is rated 'Sell' by MarketsMOJO, with this rating last updated on 09 Feb 2026. However, the analysis and financial metrics discussed here reflect the stock's current position as of 26 July 2026, providing investors with an up-to-date view of the company’s fundamentals, returns, and market performance.
Read full news article
Race Eco Chain Ltd is Rated Sell
Race Eco Chain Ltd is rated Sell by MarketsMOJO, with this rating last updated on 09 February 2026. However, all fundamentals, returns, and financial metrics discussed here reflect the company’s current position as of 15 July 2026, providing investors with an up-to-date analysis of the stock’s outlook.
Read full news article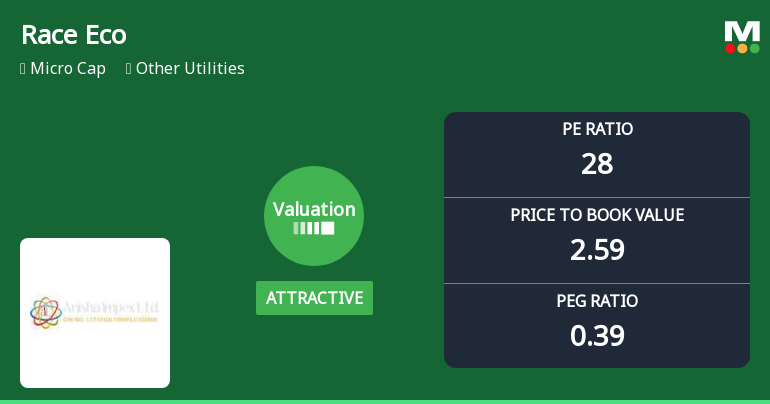
Race Eco Chain Ltd Valuation Shifts Signal Renewed Price Attractiveness Amid Market Challenges
Race Eco Chain Ltd, a micro-cap player in the Other Utilities sector, has seen a notable shift in its valuation parameters, moving from a fair to an attractive rating. Despite a challenging market environment and a significant underperformance relative to the Sensex over the past year, the stock’s price-to-earnings (P/E) and price-to-book value (P/BV) ratios suggest a more compelling entry point for investors seeking value in this segment.
Read full news article Announcements
Corporate Actions

No Upcoming Board Meetings

No Dividend history available

No Splits history available

No Bonus history available

No Rights history available
Quality key factors
Valuation key factors
Technicals key factors
 Technical Indicator Scale: Bearish, Mildly Bearish, Sideways, Mildly Bullish, Bullish Turned
 Shareholding Snapshot : Jun 2026
Shareholding Compare (%holding)
Non Institution
None
Held by 0 Schemes
Held by 1 FIIs (0.01%)
Sangeeta Pareekh (25.03%)
Puja Malik (5.84%)
30.52%
Quarterly Results Snapshot (Consolidated) - Mar'26 - YoY

YoY Growth in quarter ended Mar 2026 is -5.91% vs 127.72% in Mar 2025
YoY Growth in quarter ended Mar 2026 is 25.68% vs 1,245.45% in Mar 2025
Half Yearly Results Snapshot (Consolidated) - Sep'25

Growth in half year ended Sep 2025 is 58.34% vs 1.63% in Sep 2024
Growth in half year ended Sep 2025 is -24.15% vs 266.37% in Sep 2024
Nine Monthly Results Snapshot (Consolidated) - Dec'25
YoY Growth in nine months ended Dec 2025 is 20.80% vs 37.68% in Dec 2024
YoY Growth in nine months ended Dec 2025 is -14.34% vs 253.09% in Dec 2024
Annual Results Snapshot (Consolidated) - Mar'26
YoY Growth in year ended Mar 2026 is 11.47% vs 59.75% in Mar 2025
YoY Growth in year ended Mar 2026 is 73.78% vs 150.97% in Mar 2025
About Race Eco Chain Ltd

Company Coordinates


