
Compare Radiant Cash with Similar Stocks
Stock DNA
Diversified Commercial Services
INR 424 Cr (Micro Cap)
12.00
20
6.27%
-0.11
12.72%
1.53
Total Returns (Price + Dividend) 
Latest dividend: 2.5 per share ex-dividend date: Sep-02-2025
Risk Adjusted Returns v/s
Returns Beta

News
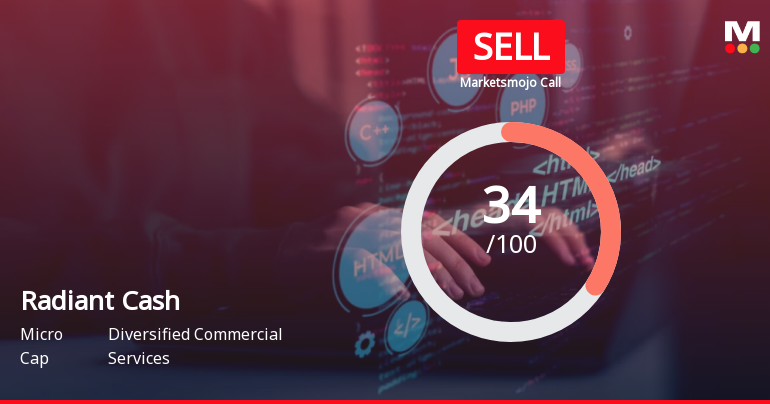
Radiant Cash Management Services Ltd is Rated Sell
Radiant Cash Management Services Ltd is rated 'Sell' by MarketsMOJO, with this rating last updated on 08 April 2026. However, the analysis and financial metrics discussed here reflect the stock's current position as of 14 June 2026, providing investors with the latest insights into the company’s performance and outlook.
Read full news article
Radiant Cash Management Services Ltd is Rated Sell
Radiant Cash Management Services Ltd is rated 'Sell' by MarketsMOJO, with this rating last updated on 08 Apr 2026. However, the analysis and financial metrics presented here reflect the stock's current position as of 03 June 2026, providing investors with an up-to-date view of the company’s performance and outlook.
Read full news article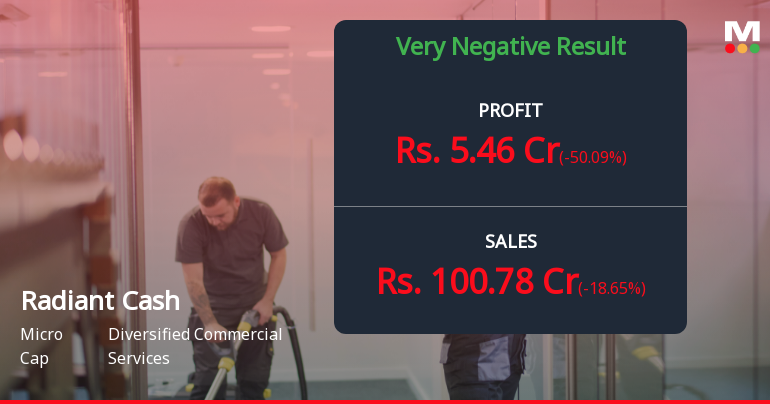
Radiant Cash Management Q4 FY26: Margin Compression and Profit Plunge Raise Serious Concerns
Radiant Cash Management Services Ltd., a Chennai-based diversified commercial services provider with a market capitalisation of ₹448.00 crores, has reported deeply concerning financial results for Q4 FY26, with consolidated net profit plunging 50.09% quarter-on-quarter to ₹5.46 crores and operating margins collapsing to multi-quarter lows. The stock, currently trading at ₹40.67, has declined 3.58% following the results announcement, extending its brutal 38.65% decline over the past year and underscoring investor anxiety about the company's deteriorating operational performance.
Read full news article Announcements
Corporate Actions

No Upcoming Board Meetings

Radiant Cash Management Services Ltd has declared 250% dividend, ex-date: 02 Sep 25

No Splits history available

No Bonus history available

No Rights history available
Quality key factors
Valuation key factors
Technicals key factors
 Technical Indicator Scale: Bearish, Mildly Bearish, Sideways, Mildly Bullish, Bullish Turned
 Shareholding Snapshot : Mar 2026
Shareholding Compare (%holding)
Promoters
None
Held by 1 Schemes (0.95%)
Held by 4 FIIs (0.3%)
Col David Devasahayam (48.95%)
Zen Securities Ltd (2.16%)
29.08%
Quarterly Results Snapshot (Consolidated) - Mar'26 - QoQ

QoQ Growth in quarter ended Mar 2026 is -18.65% vs 18.29% in Dec 2025
QoQ Growth in quarter ended Mar 2026 is -50.09% vs 28.55% in Dec 2025
Half Yearly Results Snapshot (Standalone) - Sep'25
Growth in half year ended Sep 2025 is -0.95% vs 7.26% in Sep 2024
Growth in half year ended Sep 2025 is -17.75% vs -4.30% in Sep 2024
Nine Monthly Results Snapshot (Standalone) - Dec'25
YoY Growth in nine months ended Dec 2025 is -1.57% vs 6.53% in Dec 2024
YoY Growth in nine months ended Dec 2025 is -17.82% vs -2.28% in Dec 2024
Annual Results Snapshot (Consolidated) - Mar'26
YoY Growth in year ended Mar 2026 is 0.55% vs 10.57% in Mar 2025
YoY Growth in year ended Mar 2026 is -30.62% vs 3.91% in Mar 2025
About Radiant Cash Management Services Ltd

Company Coordinates


