
Compare Radix Industries with Similar Stocks
Total Returns (Price + Dividend) 
Latest dividend: 0.5 per share ex-dividend date: Sep-22-2025
Risk Adjusted Returns v/s
Returns Beta

News
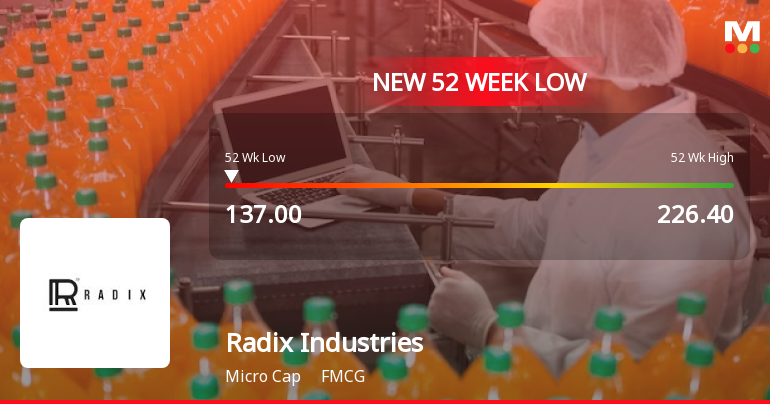
Radix Industries Falls to 52-Week Low of Rs 137 as Sell-Off Deepens
For the third consecutive session, Radix Industries (India) Ltd has seen its share price decline sharply, culminating in a fresh 52-week low of Rs 137 on 20 Jul 2026. This marks a 12.1% drop over the last three days, underscoring sustained selling pressure despite some stabilisation in broader market indices.
Read full news article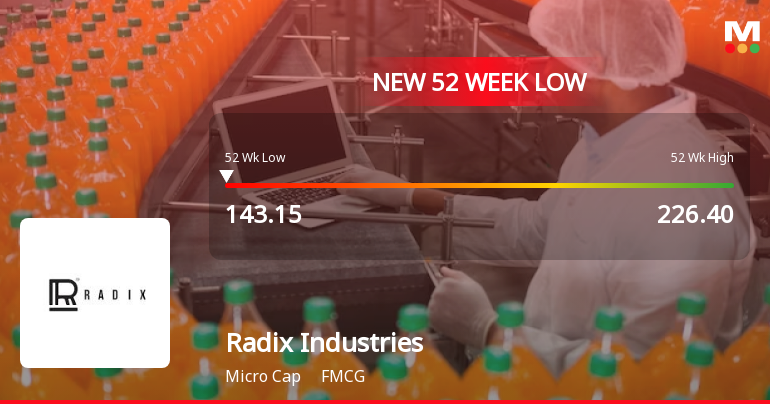
Markets Rally, But Radix Industries (India) Ltd Sinks to 52-Week Low in Stock-Specific Sell-Off
Despite a broad market upswing, Radix Industries (India) Ltd has plunged to a fresh 52-week low of Rs 143.15 on 17 Jul 2026, marking a sharp divergence from the rally seen in benchmark indices.
Read full news article
Radix Industries (India) Ltd is Rated Sell
Radix Industries (India) Ltd is rated 'Sell' by MarketsMOJO, with this rating last updated on 01 June 2026. However, the analysis and financial metrics discussed here reflect the stock's current position as of 16 July 2026, providing investors with the latest insights into the company’s performance and outlook.
Read full news article Announcements
Board Meeting Intimation for Considering And Approving The Unaudited Financial Results For The Quarter Ended 30.06.2026
17-Jul-2026 | Source : BSERadix Industries (India) Ltdhas informed BSE that the meeting of the Board of Directors of the Company is scheduled on 24/07/2026 inter alia to consider and approve the unaudited financial results for the quarter ended 30.06.2026
Closure of Trading Window
27-Jun-2026 | Source : BSEIntimation of closure of trading window under the SEBI (Prohibition of insider trading) Regulations2015
Compliances-Reg.24(A)-Annual Secretarial Compliance
30-May-2026 | Source : BSEAnnual Secretarial compliance report for the year ended 31st March 2026
Corporate Actions

24 Jul 2026

Radix Industries (India) Ltd has declared 5% dividend, ex-date: 22 Sep 25

Radix Industries (India) Ltd has announced 10:1 stock split, ex-date: 03 Feb 12

Radix Industries (India) Ltd has announced 1:2 bonus issue, ex-date: 30 Sep 19

No Rights history available
Quality key factors
Valuation key factors
Technicals key factors
 Technical Indicator Scale: Bearish, Mildly Bearish, Sideways, Mildly Bullish, Bullish Turned
 Shareholding Snapshot : Mar 2026
Shareholding Compare (%holding)
Promoters
None
Held by 0 Schemes
Held by 0 FIIs
Raghu Rama Raju Gokaraju (61.62%)
Bhupatiraju Venkatapati Raju (3%)
24.95%
Quarterly Results Snapshot (Standalone) - Mar'26 - QoQ

QoQ Growth in quarter ended Mar 2026 is -26.00% vs 44.42% in Dec 2025
QoQ Growth in quarter ended Mar 2026 is -68.31% vs 100.00% in Dec 2025
Half Yearly Results Snapshot (Standalone) - Sep'25
Growth in half year ended Sep 2025 is -0.84% vs 19.89% in Sep 2024

Growth in half year ended Sep 2025 is 40.00% vs 4.40% in Sep 2024
Nine Monthly Results Snapshot (Standalone) - Dec'25
YoY Growth in nine months ended Dec 2025 is 4.53% vs 43.42% in Dec 2024
YoY Growth in nine months ended Dec 2025 is 41.03% vs 23.42% in Dec 2024
Annual Results Snapshot (Standalone) - Mar'26
YoY Growth in year ended Mar 2026 is 4.70% vs 46.21% in Mar 2025
YoY Growth in year ended Mar 2026 is 21.67% vs 17.94% in Mar 2025
About Radix Industries (India) Ltd

Company Coordinates


