
Compare Raghuvir Synth with Similar Stocks
Dashboard
With a Operating Losses, the company has a Weak Long Term Fundamental Strength
- Low ability to service debt as the company has a high Debt to EBITDA ratio of 9.68 times
- The company has been able to generate a Return on Capital Employed (avg) of 5.15% signifying low profitability per unit of total capital (equity and debt)
Negative results in Mar 26
Risky - Negative Operating Profits
Below par performance in long term as well as near term
Stock DNA
Garments & Apparels
INR 406 Cr (Micro Cap)
NA (Loss Making)
26
0.00%
2.22
-3.77%
11.41
Total Returns (Price + Dividend) 
Raghuvir Synth for the last several years.
Risk Adjusted Returns v/s
Returns Beta

News

Raghuvir Synthetics Ltd is Rated Strong Sell
Raghuvir Synthetics Ltd is rated Strong Sell by MarketsMOJO. This rating was last updated on 06 Feb 2026. However, the analysis and financial metrics presented here reflect the stock's current position as of 22 June 2026, providing investors with the latest insights into the company’s performance and outlook.
Read full news article
Raghuvir Synthetics Ltd is Rated Strong Sell
Raghuvir Synthetics Ltd is rated Strong Sell by MarketsMOJO. This rating was last updated on 06 Feb 2026. However, the analysis and financial metrics discussed here reflect the stock's current position as of 10 June 2026, providing investors with the latest insights into the company’s performance and outlook.
Read full news article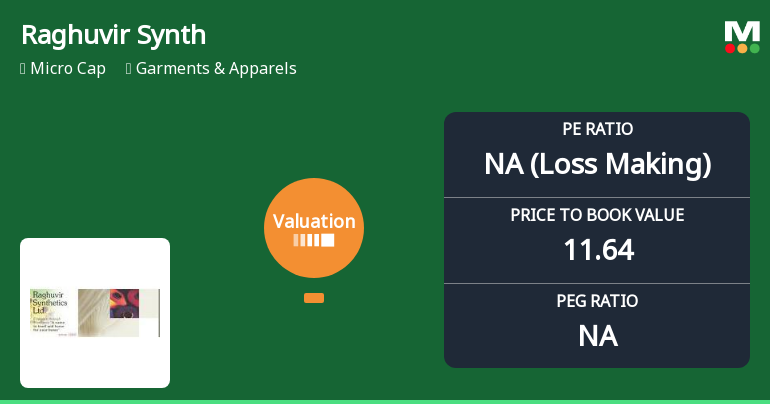
Raghuvir Synthetics Ltd Faces Valuation Challenges Amid Shifting Market Dynamics
Raghuvir Synthetics Ltd, a micro-cap player in the Garments & Apparels sector, has seen its valuation parameters shift markedly towards riskier territory, prompting a downgrade in its investment grade to Strong Sell. This article analyses the recent changes in key valuation metrics, compares them with industry peers, and assesses the implications for investors amid a challenging market backdrop.
Read full news article Announcements
Compliances-Reg.24(A)-Annual Secretarial Compliance
30-May-2026 | Source : BSEAnnual Secretarial Compliance Report for the Year ended 31.03 2026 received From Mr. Jinang Dineshkumar Shah Proprietor of M/S. Jinang shah & Associates Practising Company Secretaries pursuant to Regulation 24(A) of the Securities and Exchange Board of India(LODR)2015 read with SEBI circular No. CIR/CFD/CMD1/27/2019 dated 8th Feb. 2019.
Board Meeting Outcome for Outcome Of The Board Meeting Held On 28Th May 2026
28-May-2026 | Source : BSE1) Audited Standalone and Consolidated financial results for the quarter and Year ended 31st March 2026. As per Regulation 33 of Listing Regulations the Financial Results statement of Assets & Liabilities and Audited Report with Declaration for Non-Applicability of Statement of Impact of Audit Qualification. 2) Appointed M/s. Ashok K. Bhatt & Co. as the Internal Auditor of the Company for the FY 2026-2027. Brief Profile of the Internal Auditor are attached herewith
Board Meeting Held On 28.05.2026 To Transact & Approved Audited Standalone And Consolidated Financial Result For The Quarter And Year Ended 31.03.2026.
28-May-2026 | Source : BSEAudited standalone & consolidated financial Result as per regulation 33 of listed regulation. Appointed M/s Ashok k bhatt & co. as the Internal auditor for fy 26-27.
Corporate Actions

No Upcoming Board Meetings

No Dividend history available

Raghuvir Synthetics Ltd has announced 1:10 stock split, ex-date: 28 Oct 21

No Bonus history available

No Rights history available
Quality key factors
Valuation key factors
Technicals key factors
 Technical Indicator Scale: Bearish, Mildly Bearish, Sideways, Mildly Bullish, Bullish Turned
 Shareholding Snapshot : Mar 2026
Shareholding Compare (%holding)
Promoters
None
Held by 0 Schemes
Held by 5 FIIs (4.83%)
Sunil Raghuvirprasad Agarwal (31.4%)
Legends Global Opportunities (singapore) Pte. Ltd. (1.67%)
18.06%
Quarterly Results Snapshot (Consolidated) - Mar'26 - QoQ

QoQ Growth in quarter ended Mar 2026 is -50.60% vs -50.75% in Dec 2025
QoQ Growth in quarter ended Mar 2026 is 17.70% vs -286.70% in Dec 2025
Half Yearly Results Snapshot (Consolidated) - Sep'25

Growth in half year ended Sep 2025 is 14.60% vs 37.89% in Sep 2024
Growth in half year ended Sep 2025 is 41.49% vs 6,814.29% in Sep 2024
Nine Monthly Results Snapshot (Consolidated) - Dec'25
YoY Growth in nine months ended Dec 2025 is -4.76% vs 36.98% in Dec 2024
YoY Growth in nine months ended Dec 2025 is -53.25% vs 303.28% in Dec 2024
Annual Results Snapshot (Consolidated) - Mar'26
YoY Growth in year ended Mar 2026 is -23.27% vs 38.15% in Mar 2025
YoY Growth in year ended Mar 2026 is -114.17% vs 92.13% in Mar 2025
About Raghuvir Synthetics Ltd

Company Coordinates


