Rail Vikas

INR
205.70
-2.65 (-1.27%)
BSENSE

Sep 02, 09:27 AM

BSE+NSE Vol: 35.59 lacs

  • Price Points
  • Score
  • Mojo Parameters
  • Total Return
  • News and Corporate Actions
  • Key factors
  • Shareholding
  • Financials
  • CompanyCV
stock-summaryPrice Point
High/Low

1Day

52 Week

Valuation
Technical
Day's Volume

CASH

35.59 lacs (8,587.87%) Volume

Shareholding (Jun 2026)

FII

2.41%

Held by 137 FIIs

DII

6.61%

Held by 29 DIIs

Promoter

72.84%

Why is Rail Vikas Nigam Ltd falling/rising?

02-Sep-2026

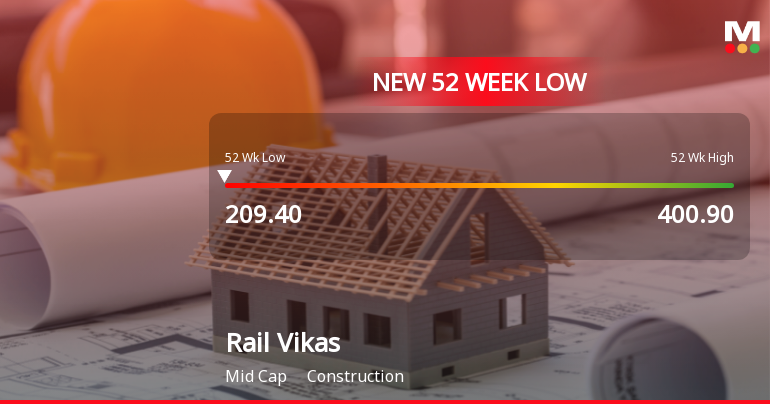
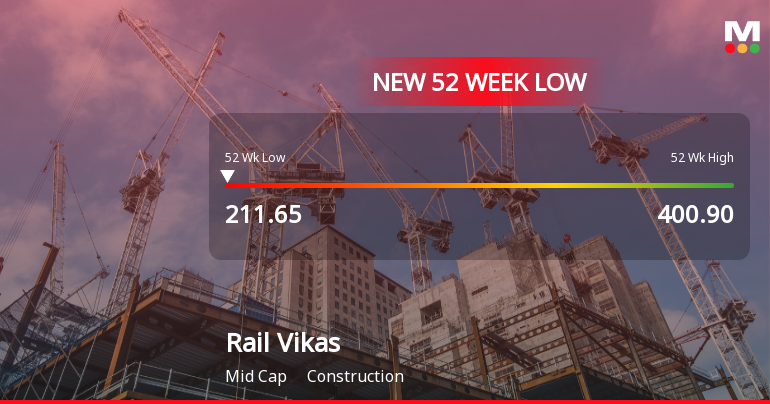
As of 01-Sep, Rail Vikas Nigam Ltd's stock price is declining, currently at Rs. 208.35, marking a 0.74% decrease and a new 52-week low. The stock has underperformed significantly over various time frames, with a year-to-date decline of 41.70%, reflecting poor financial performance and reduced investor confidence.

As of 01-Sep, Rail Vikas Nigam Ltd's stock price is falling, currently at Rs. 208.35, which reflects a decrease of Rs. 1.55 or 0.74%. The stock has hit a new 52-week low today and has been on a consecutive decline for the last four days, resulting in a total drop of 5.83% during this period. Additionally, the stock has underperformed the sector by 3.42% today.<BR><BR>Over the past week, the stock has decreased by 4.60%, and in the last month, it has fallen by 7.58%. Year-to-date, the stock has experienced a significant decline of 41.70%, while its performance over the past year shows a drop of 34.00%. This stark contrast is evident as the broader market, represented by the BSE500, has generated positive returns of 2.32% in the same timeframe.<BR><BR>The stock is trading below its moving averages across various time frames, indicating a bearish trend. Furthermore, there has been a notable decrease in investor participation, with delivery volume falling by 6.59% compared to the 5-day average. Institutional investors have also reduced their stake by 2.27% in the previous quarter, which reflects a lack of confidence in the stock's future performance.<BR><BR>Financially, the company has shown poor long-term growth, with operating profit declining at an annual rate of 2.08% over the last five years. Recent negative results, including a 41.28% drop in profit after tax over the last six months, and the lowest recorded return on capital employed at 10.87%, further contribute to the stock's declining value. Overall, these factors indicate a challenging environment for Rail Vikas Nigam Ltd, leading to its current falling stock price.

View full answer

Who are in the management team of Rail Vikas?

01-Sep-2026

The management team of Rail Vikas includes Pradeep Gaur (Chairman & Managing Director), Vinay Singh (Whole-Time Director & Director - Projects), Rajesh Prasad (Whole-Time Director & Director - Operations), Sanjeeb Kumar (Whole-Time Director & Director - Finance), Anupam Ban (Director - Personnel), Dhananjaya Singh (Nominee - Government), and independent directors V. Natesan and Anupam Mallik. They oversee the company's operations and strategic direction.

The management team of Rail Vikas includes the following individuals:<BR><BR>1. **Pradeep Gaur** - Chairman & Managing Director<BR>2. **Vinay Singh** - Whole-Time Director & Director (Projects)<BR>3. **Rajesh Prasad** - Whole-Time Director & Director (Operations)<BR>4. **Sanjeeb Kumar** - Whole-Time Director & Director (Finance)<BR>5. **Anupam Ban** - Director (Personnel)<BR>6. **Dhananjaya Singh** - Nominee (Government)<BR>7. **V. Natesan** - Independent Director<BR>8. **Anupam Mallik** - Independent Director<BR><BR>This team oversees various aspects of the company's operations and strategic direction.

View full answer

What does Rail Vikas do?

01-Sep-2026

Rail Vikas Nigam Ltd is a government-owned company established in 2003, focused on construction in the rail sector, with a market cap of INR 44,234 Cr and a recent net profit of 159 Cr. It was designated as a Navratna Company in May 2023.

Overview:<BR>Rail Vikas Nigam Ltd is a wholly owned Government Company operating in the construction industry, categorized as a mid-cap entity.<BR><BR>History:<BR>Incorporated in New Delhi in 2003, Rail Vikas Nigam Ltd received its Certificate of Commencement of Business on February 18, 2003. The company was conferred the status of 'Schedule A - Public Sector Enterprise' and recognized as a Navratna Company effective May 1, 2023. The latest reported financial results are for the quarter ending June 2026.<BR><BR>Financial Snapshot:<BR>Most recent Net Sales: 4,321 Cr (Quarterly Results - Jun 2026) <BR>Most recent Net Profit: 159 Cr (Quarterly Results - Jun 2026) <BR>Market-cap value: INR 44,234 Cr (Mid Cap)<BR><BR>Key Metrics:<BR>P/E: 49.00 <BR>Industry P/E: 35 <BR>Dividend Yield: 0.79% <BR>Debt-Equity: 0.39 <BR>Return on Equity: 8.91% <BR>Price to Book: 4.55 <BR><BR>Contact Details:<BR>Details: No Company Details Available <BR>Registrar Address: Not available.

View full answer

Who are the peers of the Rail Vikas?

01-Sep-2026

Rail Vikas's peers include Larsen & Toubro, Altius Telecom, Kalpataru Projects, IRB Infra Development, NBCC, Cemindia Project, IndiGrid Trust, National High, IRB Infra Trust, and Vertis Infra. Rail Vikas has below-average growth and capital structure, with a 1-year return of -30.68%, the lowest among its peers.

Peers: The peers of Rail Vikas are Larsen & Toubro, Altius Telecom, Kalpataru Proj., IRB Infra.Devl., NBCC, Cemindia Project, IndiGrid Trust, National High, IRB Infra. Trust, and Vertis Infra.<BR><BR>Quality Snapshot: Excellent management risk is observed at NBCC and Cemindia Project, while Good management risk is found at Larsen & Toubro and Kalpataru Proj., Average management risk is present at Altius Telecom, Rail Vikas, IRB Infra.Devl., IndiGrid Trust, and Vertis Infra., and Below Average management risk is noted at National High and IRB Infra. Trust. For Growth, Excellent growth is seen at Altius Telecom and Cemindia Project, while Good growth is found at NBCC and Average growth is present at Kalpataru Proj. and IndiGrid Trust, with Below Average growth at Rail Vikas and IRB Infra.Devl. Lastly, Excellent capital structure is noted at NBCC and IndiGrid Trust, Good capital structure is found at Cemindia Project, while Average capital structure is present at Larsen & Toubro, Kalpataru Proj., and Rail Vikas, and Below Average capital structure is seen at Altius Telecom, IRB Infra.Devl., National High, IRB Infra. Trust, and Vertis Infra.<BR><BR>Return Snapshot: The peer with the highest 1-year return is Cemindia Project at 73.09%, while Rail Vikas has the lowest at -30.68%. Rail Vikas's 1-year return is significantly lower than all its peers. Additionally, the six-month return is negative for Rail Vikas, IRB Infra.Devl., NBCC, and IRB Infra. Trust.

View full answer

How big is Rail Vikas?

01-Sep-2026

As of 31st August, Rail Vikas Nigam Ltd has a market capitalization of 44,234.00 Cr, with recent net sales of 20,824.58 Cr and a net profit of 899.55 Cr.

As of 31st August, Rail Vikas Nigam Ltd has a market capitalization of 44,234.00 Cr, categorizing it as a Mid Cap company.<BR><BR>In the latest four quarters, Rail Vikas reported Net Sales of 20,824.58 Cr and a Net Profit of 899.55 Cr.<BR><BR>For the reporting period of March 2026, the company has Shareholder's Funds amounting to 9,821.84 Cr and Total Assets of 21,681.11 Cr.

View full answer

Should I buy, sell or hold Rail Vikas Nigam Ltd?

13-Aug-2026

When is the next results date for Rail Vikas Nigam Ltd?

04-Aug-2026

The next results date for Rail Vikas Nigam Ltd is 11 August 2026.

The next results date for Rail Vikas Nigam Ltd is scheduled for 11 August 2026.

View full answer

Are Rail Vikas Nigam Ltd latest results good or bad?

26-May-2026

Rail Vikas Nigam Ltd's latest results are concerning, showing record net sales of ₹6,695.91 crores but a significant net profit decline of 58.92% year-on-year, indicating serious profitability issues and negative investor sentiment. Overall, the results lean towards the "bad" side despite revenue growth.

Rail Vikas Nigam Ltd's latest results indicate a challenging financial situation. While the company achieved record net sales of ₹6,695.91 crores in Q4 FY26, reflecting a year-on-year growth of 4.18% and a significant sequential increase of 42.94%, this top-line growth is overshadowed by a dramatic decline in profitability. The consolidated net profit fell to ₹187.07 crores, down 58.92% year-on-year and 42.05% quarter-on-quarter. <BR><BR>The operating margin has also deteriorated significantly, dropping to 4.01% from 6.74% a year ago, and the profit after tax (PAT) margin fell to 2.71% from 7.09%. This indicates severe margin compression and raises concerns about the company's cost management and project execution efficiency.<BR><BR>Investor sentiment appears to be negative, as reflected in the stock's performance, which closed 3.72% lower following the results announcement. Overall, the results suggest that while the company is generating higher revenues, it is struggling with fundamental profitability issues, making the latest results lean towards the "bad" side.

View full answer

Is Rail Vikas technically bullish or bearish?

02-Dec-2025

As of December 1, 2025, the market trend is bearish with moderate strength, supported by bearish indicators from the MACD, moving averages, and Bollinger Bands, despite mixed signals from the KST and a lack of clarity in Dow Theory and RSI.

As of 1 December 2025, the technical trend has changed from mildly bearish to bearish. The current stance is bearish with a moderate strength. Key indicators driving this assessment include the weekly MACD being bearish, the daily moving averages indicating a bearish trend, and both the weekly and monthly Bollinger Bands also showing bearish signals. The KST presents a mildly bullish signal on the weekly timeframe but is mildly bearish on the monthly, indicating mixed signals. Overall, the lack of a clear trend in Dow Theory and the absence of signals from the RSI further support the bearish outlook.

View full answer

How has been the historical performance of Rail Vikas?

13-Nov-2025

Rail Vikas experienced a decline in net sales and profits from March 2024 to March 2025, with net sales dropping to 19,923.02 Cr and profit after tax falling to 1,186.11 Cr. However, total assets and liabilities increased to 20,436.23 Cr, while net cash inflow improved significantly to 2,023.00 Cr.

Answer:<BR>The historical performance of Rail Vikas shows a fluctuating trend in net sales and profits over the years, with net sales reaching 19,923.02 Cr in March 2025, down from 21,878.53 Cr in March 2024. The total operating income followed a similar pattern, peaking at 21,878.53 Cr in March 2024 before declining to 19,923.02 Cr in March 2025. Operating profit (PBDIT) also saw a decrease, falling to 2,124.88 Cr in March 2025 from 2,538.73 Cr in the previous year. Profit before tax decreased to 1,554.62 Cr in March 2025, compared to 1,949.30 Cr in March 2024, while profit after tax was reported at 1,186.11 Cr in March 2025, down from 1,470.15 Cr in March 2024. The consolidated net profit for March 2025 was 1,281.39 Cr, a decline from 1,550.69 Cr in March 2024. <BR><BR>In terms of assets and liabilities, total assets increased to 20,436.23 Cr in March 2025 from 19,562.52 Cr in March 2024, while total liabilities also rose to 20,436.23 Cr from 19,562.52 Cr in the same period. The company’s cash flow from operating activities decreased to 1,878.00 Cr in March 2025, down from 2,955.00 Cr in March 2024, but net cash inflow improved significantly to 2,023.00 Cr from 267.00 Cr. The earnings per share (EPS) for March 2025 was 6.15, a decrease from 7.44 in March 2024, while the book value per share increased to 45.9 from 41.83.<BR><BR>Breakdown:<BR>Rail Vikas experienced a decline in net sales from 21,878.53 Cr in March 2024 to 19,923.02 Cr in March 2025, alongside a decrease in total operating income, which fell to 19,923.02 Cr. Operating profit (PBDIT) also decreased to 2,124.88 Cr, while profit before tax dropped to 1,554.62 Cr, leading to a profit after tax of 1,186.11 Cr. The consolidated net profit for March 2025 was 1,281.39 Cr, down from 1,550.69 Cr in the previous year. On the balance sheet, total assets and total liabilities both increased to 20,436.23 Cr. Cash flow from operating activities decreased to 1,878.00 Cr, but net cash inflow improved to 2,023.00 Cr. The earnings per share decreased to 6.15, while the book value per share rose to 45.9, indicating a mixed performance in profitability and asset management.

View full answer

How has been the historical performance of Rail Vikas?

12-Nov-2025

Rail Vikas saw a decline in net sales from 21,878.53 Cr in March 2024 to 19,923.02 Cr in March 2025, with operating profit also decreasing to 2,124.88 Cr. However, profit before tax remained strong at 1,554.62 Cr, and total assets increased to 20,436.23 Cr, indicating improved financial positioning despite lower cash flow from operations.

Answer:<BR>The historical performance of Rail Vikas shows a fluctuating trend in net sales and profits over the years, with net sales reaching 19,923.02 Cr in March 2025, down from 21,878.53 Cr in March 2024. The total operating income followed a similar pattern, peaking at 21,878.53 Cr in March 2024 before declining to 19,923.02 Cr in March 2025. Operating profit (PBDIT) also decreased from 2,538.73 Cr in March 2024 to 2,124.88 Cr in March 2025. Despite the drop in sales and operating profit, profit before tax remained relatively strong at 1,554.62 Cr in March 2025, although it was lower than the previous year's 1,949.30 Cr. Profit after tax also saw a decline, falling to 1,186.11 Cr in March 2025 from 1,470.15 Cr in March 2024. The company's total assets increased to 20,436.23 Cr in March 2025, up from 19,562.52 Cr in March 2024, while total liabilities also rose to 20,436.23 Cr from 19,562.52 Cr in the same period. Cash flow from operating activities decreased to 1,878.00 Cr in March 2025 from 2,955.00 Cr in March 2024, but net cash inflow improved significantly to 2,023.00 Cr in March 2025 compared to 267.00 Cr in March 2024.<BR><BR>Breakdown:<BR>Rail Vikas experienced a decline in net sales from 21,878.53 Cr in March 2024 to 19,923.02 Cr in March 2025, while total operating income mirrored this trend, decreasing to 19,923.02 Cr. Operating profit (PBDIT) also fell to 2,124.88 Cr from 2,538.73 Cr. Despite these decreases, profit before tax remained robust at 1,554.62 Cr, although it was lower than the previous year's figure. Profit after tax similarly declined to 1,186.11 Cr from 1,470.15 Cr. On the balance sheet, total assets increased to 20,436.23 Cr, reflecting growth in the company's financial position, while total liabilities rose correspondingly. Cash flow from operating activities decreased, but net cash inflow showed a significant improvement, indicating better liquidity management in the latest fiscal year.

View full answer

Is Rail Vikas overvalued or undervalued?

18-Jul-2025

As of July 17, 2025, Rail Vikas is considered overvalued with a high PE ratio of 62.07 and underperformance against the Sensex, indicating a valuation grade of expensive despite a slight improvement from very expensive.

As of 17 July 2025, the valuation grade for Rail Vikas has moved from very expensive to expensive, indicating a slight improvement in its perceived value. The company is currently considered overvalued based on its high valuation ratios, including a PE ratio of 62.07, an EV to EBITDA ratio of 71.62, and a Price to Book Value of 9.05. <BR><BR>In comparison to its peers, Rail Vikas stands out with a significantly higher PE ratio than Ircon International, which has a PE of 24.53, and even higher than Shriram Pistons at 21.39. The PEG ratio of 0.00 suggests that the company may not be growing at a rate that justifies its high valuation. Additionally, the stock has underperformed against the Sensex over the past year, with a return of -38.49% compared to the Sensex's 1.91%, reinforcing the notion that Rail Vikas is overvalued in the current market environment.

View full answer

Who are the top shareholders of the Rail Vikas?

06-Jun-2025

The top shareholders of Rail Vikas include the President of India with 72.84%, Life Insurance Corporation of India at 5.84%, and foreign institutional investors holding 5.07%. Individual investors own 14.94%, while mutual funds collectively hold 0.21%.

The top shareholders of Rail Vikas include the President of India, who holds the largest stake at 72.84%. Other significant shareholders are the Life Insurance Corporation of India, with a holding of 5.84%, and foreign institutional investors (FIIs), which collectively hold 5.07% through 417 different entities. Additionally, individual investors account for 14.94% of the company's shares. There are also 21 mutual fund schemes that hold a small portion, totaling 0.21%.

View full answer

Has Rail Vikas declared dividend?

06-Jun-2025

Rail Vikas Nigam Ltd has declared a 21% dividend, amounting to ₹2.1 per share, with an ex-date of September 23, 2024. While recent returns have fluctuated, the company has shown substantial long-term growth, particularly in price returns over the past five years.

Rail Vikas Nigam Ltd has declared a 21% dividend.<BR><BR>Dividend Details:<BR>- Percentage announced: 21%<BR>- Amount per share: 2.1<BR>- Ex-date: 23 Sep 24<BR><BR>Dividend Yield: 0.49%.<BR><BR>Total Returns by Period:<BR>In the last 6 months, the price return was -7.72%, with a dividend return of 0%, resulting in a total return of -7.72%.<BR><BR>Over the past year, the price return was 16.26%, with a dividend return of 0.54%, leading to a total return of 16.8%.<BR><BR>In the 2-year period, the price return was 257.44%, with a dividend return of 1.93%, culminating in a total return of 259.37%.<BR><BR>For the 3-year period, the price return was 1225.35%, while the dividend return was 14.31%, resulting in a total return of 1239.66%.<BR><BR>In the last 4 years, the price return was 1298.86%, with a dividend return of 19.05%, which led to a total return of 1317.91%.<BR><BR>Over the past 5 years, the price return was 2150.66%, with a dividend return of 41.48%, resulting in a total return of 2192.14%.<BR><BR>Overall, Rail Vikas Nigam Ltd has declared a significant dividend, and while recent returns have varied, the long-term performance shows substantial growth, particularly in price returns over extended periods.

View full answer
iScoreScore
Click here to find our call on this stock
Strong Sell
Sell
Hold
Buy
Strong Buy

Dashboard

1

Poor long term growth as Operating profit has grown by an annual rate -2.08% of over the last 5 years

 
2

Negative results in Jun 26

3

With ROCE of 5.3, it has a Expensive valuation with a 3.5 Enterprise value to Capital Employed

4

Falling Participation by Institutional Investors

5

Underperformed the market in the last 1 year

stock-summaryMojo Parameters

Mojo Parameters

Loading Valuation Snapshot...

Stock DNA

stock-summary
Industry

Construction

stock-summary
Market cap

INR 42,889 Cr (Mid Cap)

stock-summary
P/E

48.00

stock-summary
Industry P/E

35

stock-summary
Dividend Yield

0.82%

stock-summary
Debt Equity

0.39

stock-summary
Return on Equity

8.91%

stock-summary
Price to Book

4.42

Revenue and Profits:
Net Sales:
4,321 Cr
(Quarterly Results - Jun 2026)
Net Profit:
159 Cr
stock-summaryTotal Returns
Total Returns (Price + Dividend) stock-summary
Dividend Yield (0.82%)
TimePeriod
Price Return
Dividend Return
Total Return
3 Months
-14.56%
0.30%
-14.26%
6 Months
-31.34%
0.24%
-31.1%
1 Year
-38.0%
0.51%
-37.49%
2 Years
-65.78%
1.00%
-64.78%
3 Years
48.79%
3.51%
52.3%
4 Years
528.09%
21.34%
549.43%
5 Years
629.43%
31.74%
661.17%

Latest dividend: 0.7 per share ex-dividend date: Aug-18-2026

Risk Adjusted Returns v/s stock-summary
Returns Beta
Icon
Beta has not been calculated since enough price history is not available
stock-summaryNews & Corporate Actions

Announcements stock-summary

Announcement under Regulation 30 (LODR)-Change in Management

31-Aug-2026 | Source : BSE

Intimation regarding Change in the Senior Management

Announcement under Regulation 30 (LODR)-Change in Directorate

27-Aug-2026 | Source : BSE

Re-appointment of an Additional Director designated as Independent Director on the Board of Rail Vikas Nigam Limited

Disclosure Under Regulation 30 Of SEBI (LODR) Regulations 2015-Imposition Of Fine By NSE For The Quarter Ended 30Th June 2026

26-Aug-2026 | Source : BSE

Disclosure under Regulation 30 of SEBI (LODR) Regulations 2015- Imposition of fine by NSE for the quarter ended 30th June 2026

Corporate Actions stock-summary

stock-summary
BOARD MEETING

No Upcoming Board Meetings

stock-summary
DIVIDEND

Rail Vikas Nigam Ltd has declared 7% dividend, ex-date: 18 Aug 26

stock-summary
SPLITS

No Splits history available

stock-summary
BONUS

No Bonus history available

stock-summary
RIGHTS

No Rights history available

stock-summaryKey Factors

Quality key factors stock-summary

Factor
Value
Sales Growth (5y)
4.94%
EBIT Growth (5y)
-2.08%
EBIT to Interest (avg)
2.21
Debt to EBITDA (avg)
5.18
Net Debt to Equity (avg)
0.39
Sales to Capital Employed (avg)
1.45
Tax Ratio
27.25%
Dividend Payout Ratio
27.99%
Pledged Shares
0
Institutional Holding
9.02%
ROCE (avg)
10.96%
ROE (avg)
15.71%

Valuation key factors

Factor
Value
P/E Ratio
48
Industry P/E
35
Price to Book Value
4.42
EV to EBIT
55.45
EV to EBITDA
53.09
EV to Capital Employed
3.46
EV to Sales
2.27
PEG Ratio
NA
Dividend Yield
0.82%
ROCE (Latest)
5.29%
ROE (Latest)
8.91%

Technicals key factors

Indicator
Weekly
Monthly
MACD
Mildly Bullish
Bearish
RSI
No Signal
No Signal
Bollinger Bands
Bearish
Bearish
Moving Averages
Bearish (Daily)
KST
Bearish
Bearish
Dow Theory
Mildly Bearish
Mildly Bearish
OBV
Mildly Bearish
No Trend
stock-summary Technical Indicator Scale: Bearish, Mildly Bearish, Sideways, Mildly Bullish, Bullish  Turned 
stock-summaryShareholding
Shareholding Snapshot : Jun 2026stock-summary
Shareholding Compare (%holding) stock-summary
Majority shareholders

Promoters

Pledged Promoter Holdings

None

Mutual Funds

Held by 24 Schemes (0.36%)

FIIs

Held by 137 FIIs (2.41%)

Promoter with highest holding

President Of India (72.84%)

Highest Public shareholder

Life Insurance Corporation Of India (6.12%)

Individual Investors Holdings

16.78%

stock-summaryFinancial
[
  {
    "link": "quarterly",
    "btn_text": "All Quarterly Results",
    "header": "Quarterly Results Snapshot (Consolidated) - Jun'26 - QoQ",
    "rhs": [
      {
        "prefix": "Net Sales ",
        "suffix": "QoQ Growth in quarter ended Jun 2026 is -35.46% vs 42.94% in Mar 2026",
        "dir": -1
      },
      {
        "prefix": "Consolidated Net Profit ",
        "suffix": "QoQ Growth in quarter ended Jun 2026 is -14.81% vs -42.05% in Mar 2026",
        "dir": 1
      }
    ],
    "table": {
      "header": [
        "Jun'26",
        "Mar'26",
        "Change(%)"
      ],
      "body": [
        {
          "field": "Net Sales",
          "val1": "4,321.23",
          "val2": "6,695.91",
          "chgp": "-35.46%",
          "chgp_class": "negative"
        },
        {
          "field": "Operating Profit (PBDIT) excl Other Income",
          "val1": "184.62",
          "val2": "268.53",
          "chgp": "-31.25%",
          "chgp_class": "negative"
        },
        {
          "field": "Interest",
          "val1": "97.88",
          "val2": "97.55",
          "chgp": "0.34%",
          "chgp_class": "negative"
        },
        {
          "field": "Exceptional Items",
          "val1": "0.00",
          "val2": "0.00",
          "chgp": "",
          "chgp_class": "neutral"
        },
        {
          "field": "Consolidate Net Profit",
          "val1": "159.36",
          "val2": "187.07",
          "chgp": "-14.81%",
          "chgp_class": "negative"
        },
        {
          "field": "Operating Profit Margin (Excl OI)",
          "val1": "4.27%",
          "val2": "4.01%",
          "chgp": "0.26%",
          "chgp_class": "positive"
        }
      ]
    }
  },
  {
    "link": "half-yearly",
    "btn_text": "All Half Yearly Results",
    "header": "Half Yearly Results Snapshot (Consolidated) - Sep'25",
    "rhs": [
      {
        "prefix": "Net Sales ",
        "suffix": " Growth in half year ended Sep 2025 is 1.15% vs -14.85% in Sep 2024",
        "dir": 1
      },
      {
        "prefix": "Consolidated Net Profit ",
        "suffix": " Growth in half year ended Sep 2025 is -28.58% vs -30.71% in Sep 2024",
        "dir": 1
      }
    ],
    "table": {
      "header": [
        "Sep'25",
        "Sep'24",
        "Change(%)"
      ],
      "body": [
        {
          "field": "Net Sales",
          "val1": "9,031.75",
          "val2": "8,928.75",
          "chgp": "1.15%",
          "chgp_class": "positive"
        },
        {
          "field": "Operating Profit (PBDIT) excl Other Income",
          "val1": "269.79",
          "val2": "453.00",
          "chgp": "-40.44%",
          "chgp_class": "negative"
        },
        {
          "field": "Interest",
          "val1": "208.18",
          "val2": "277.95",
          "chgp": "-25.10%",
          "chgp_class": "positive"
        },
        {
          "field": "Exceptional Items",
          "val1": "0.00",
          "val2": "0.00",
          "chgp": "",
          "chgp_class": "neutral"
        },
        {
          "field": "Consolidate Net Profit",
          "val1": "364.82",
          "val2": "510.80",
          "chgp": "-28.58%",
          "chgp_class": "negative"
        },
        {
          "field": "Operating Profit Margin (Excl OI)",
          "val1": "2.99%",
          "val2": "5.07%",
          "chgp": "-2.08%",
          "chgp_class": "negative"
        }
      ]
    }
  },
  {
    "link": "nine-monthly",
    "btn_text": "All Nine Monthly Results",
    "header": "Nine Monthly Results Snapshot (Consolidated) - Dec'25",
    "rhs": [
      {
        "prefix": "Net Sales ",
        "suffix": "YoY Growth in nine months ended Dec 2025 is 1.63% vs -11.06% in Dec 2024",
        "dir": 1
      },
      {
        "prefix": "Consolidated Net Profit ",
        "suffix": "YoY Growth in nine months ended Dec 2025 is -16.37% vs -24.96% in Dec 2024",
        "dir": 1
      }
    ],
    "table": {
      "header": [
        "Dec'25",
        "Dec'24",
        "Change(%)"
      ],
      "body": [
        {
          "field": "Net Sales",
          "val1": "13,716.21",
          "val2": "13,496.13",
          "chgp": "1.63%",
          "chgp_class": "positive"
        },
        {
          "field": "Operating Profit (PBDIT) excl Other Income",
          "val1": "490.51",
          "val2": "692.31",
          "chgp": "-29.15%",
          "chgp_class": "negative"
        },
        {
          "field": "Interest",
          "val1": "312.97",
          "val2": "422.54",
          "chgp": "-25.93%",
          "chgp_class": "positive"
        },
        {
          "field": "Exceptional Items",
          "val1": "0.00",
          "val2": "0.00",
          "chgp": "",
          "chgp_class": "neutral"
        },
        {
          "field": "Consolidate Net Profit",
          "val1": "687.65",
          "val2": "822.24",
          "chgp": "-16.37%",
          "chgp_class": "negative"
        },
        {
          "field": "Operating Profit Margin (Excl OI)",
          "val1": "3.58%",
          "val2": "5.13%",
          "chgp": "-1.55%",
          "chgp_class": "negative"
        }
      ]
    }
  },
  {
    "link": "annual",
    "btn_text": "All Annual Results",
    "header": "Annual Results Snapshot (Consolidated) - Mar'26",
    "rhs": [
      {
        "prefix": "Net Sales ",
        "suffix": "YoY Growth in year ended Mar 2026 is 2.45% vs -8.94% in Mar 2025",
        "dir": 1
      },
      {
        "prefix": "Consolidated Net Profit ",
        "suffix": "YoY Growth in year ended Mar 2026 is -31.54% vs -17.61% in Mar 2025",
        "dir": -1
      }
    ],
    "table": {
      "header": [
        "Mar'26",
        "Mar'25",
        "Change(%)"
      ],
      "body": [
        {
          "field": "Net Sales",
          "val1": "20,412.12",
          "val2": "19,923.25",
          "chgp": "2.45%",
          "chgp_class": "positive"
        },
        {
          "field": "Operating Profit (PBDIT) excl Other Income",
          "val1": "767.48",
          "val2": "1,125.30",
          "chgp": "-31.80%",
          "chgp_class": "negative"
        },
        {
          "field": "Interest",
          "val1": "418.98",
          "val2": "539.52",
          "chgp": "-22.34%",
          "chgp_class": "positive"
        },
        {
          "field": "Exceptional Items",
          "val1": "0.00",
          "val2": "0.00",
          "chgp": "",
          "chgp_class": "neutral"
        },
        {
          "field": "Consolidate Net Profit",
          "val1": "874.70",
          "val2": "1,277.66",
          "chgp": "-31.54%",
          "chgp_class": "negative"
        },
        {
          "field": "Operating Profit Margin (Excl OI)",
          "val1": "3.76%",
          "val2": "5.65%",
          "chgp": "-1.89%",
          "chgp_class": "negative"
        }
      ]
    }
  }
]

Quarterly Results Snapshot (Consolidated) - Jun'26 - QoQstock-summary

Jun'26
Mar'26
Change(%)
Net Sales
4,321.23
6,695.91
-35.46%
Operating Profit (PBDIT) excl Other Income
184.62
268.53
-31.25%
Interest
97.88
97.55
0.34%
Exceptional Items
0.00
0.00
Consolidate Net Profit
159.36
187.07
-14.81%
Operating Profit Margin (Excl OI)
4.27%
4.01%
0.26%
Values in Rs Cr.
Direction Arrows
Net Sales

QoQ Growth in quarter ended Jun 2026 is -35.46% vs 42.94% in Mar 2026

Direction Arrows
Consolidated Net Profit

QoQ Growth in quarter ended Jun 2026 is -14.81% vs -42.05% in Mar 2026

Half Yearly Results Snapshot (Consolidated) - Sep'25stock-summary

Sep'25
Sep'24
Change(%)
Net Sales
9,031.75
8,928.75
1.15%
Operating Profit (PBDIT) excl Other Income
269.79
453.00
-40.44%
Interest
208.18
277.95
-25.10%
Exceptional Items
0.00
0.00
Consolidate Net Profit
364.82
510.80
-28.58%
Operating Profit Margin (Excl OI)
2.99%
5.07%
-2.08%
Values in Rs Cr.
Direction Arrows
Net Sales

Growth in half year ended Sep 2025 is 1.15% vs -14.85% in Sep 2024

Direction Arrows
Consolidated Net Profit

Growth in half year ended Sep 2025 is -28.58% vs -30.71% in Sep 2024

Nine Monthly Results Snapshot (Consolidated) - Dec'25stock-summary

Dec'25
Dec'24
Change(%)
Net Sales
13,716.21
13,496.13
1.63%
Operating Profit (PBDIT) excl Other Income
490.51
692.31
-29.15%
Interest
312.97
422.54
-25.93%
Exceptional Items
0.00
0.00
Consolidate Net Profit
687.65
822.24
-16.37%
Operating Profit Margin (Excl OI)
3.58%
5.13%
-1.55%
Values in Rs Cr.
Direction Arrows
Net Sales

YoY Growth in nine months ended Dec 2025 is 1.63% vs -11.06% in Dec 2024

Direction Arrows
Consolidated Net Profit

YoY Growth in nine months ended Dec 2025 is -16.37% vs -24.96% in Dec 2024

Annual Results Snapshot (Consolidated) - Mar'26stock-summary

Mar'26
Mar'25
Change(%)
Net Sales
20,412.12
19,923.25
2.45%
Operating Profit (PBDIT) excl Other Income
767.48
1,125.30
-31.80%
Interest
418.98
539.52
-22.34%
Exceptional Items
0.00
0.00
Consolidate Net Profit
874.70
1,277.66
-31.54%
Operating Profit Margin (Excl OI)
3.76%
5.65%
-1.89%
Values in Rs Cr.
Direction Arrows
Net Sales

YoY Growth in year ended Mar 2026 is 2.45% vs -8.94% in Mar 2025

Direction Arrows
Consolidated Net Profit

YoY Growth in year ended Mar 2026 is -31.54% vs -17.61% in Mar 2025

stock-summaryCompany CV
About Rail Vikas Nigam Ltd stock-summary
stock-summary
Rail Vikas Nigam Ltd
Mid Cap
Construction
Rail Vikas Nigam Limited was incorporated in New Delhi as a Public Limited Company on 24 January 2003. The Company was issued its Certificate of Commencement of Business on February 18, 2003. Further, the Company has been conferred the status of `Schedule A - Public Sector Enterprise' and a Navratna Company effective from 1st May 2023. The Company is a wholly owned Government Company, as a project executing agency working for and on behalf of MoR.
Company Coordinates stock-summary
Icon
No Company Details Available